
Figure 6.
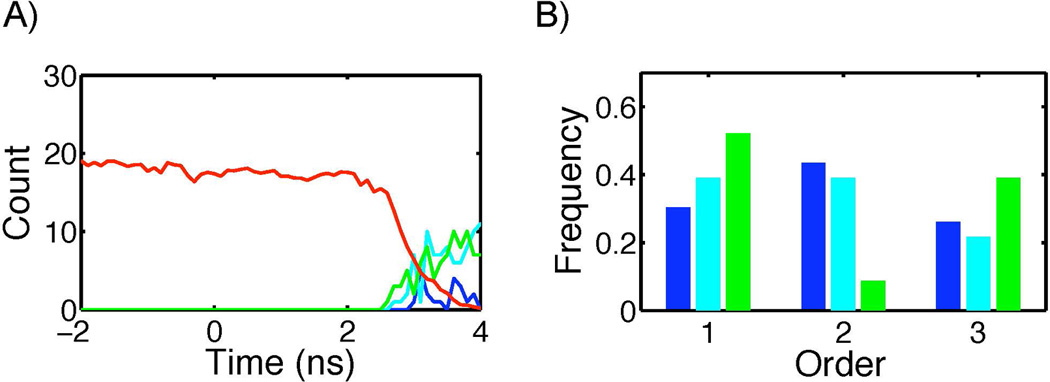
Changes in molecular composition at the interface. A) The evolution of the number of water (red) and each hydrophobic moiety (blue: lipid tails of liposome, cyan: lipid tails of PFOB-NEP, green:PFOB) at the interface is plotted with the fusion initiation point (A in Figure 5A) set at zero in time. This particular profile was obtained from the fusion simulation L2-N4-1. B) The frequencies to observe the hydrophobic moieties at the interface first, second, and third was plotted with the same color code used in A.