
Figure 9.
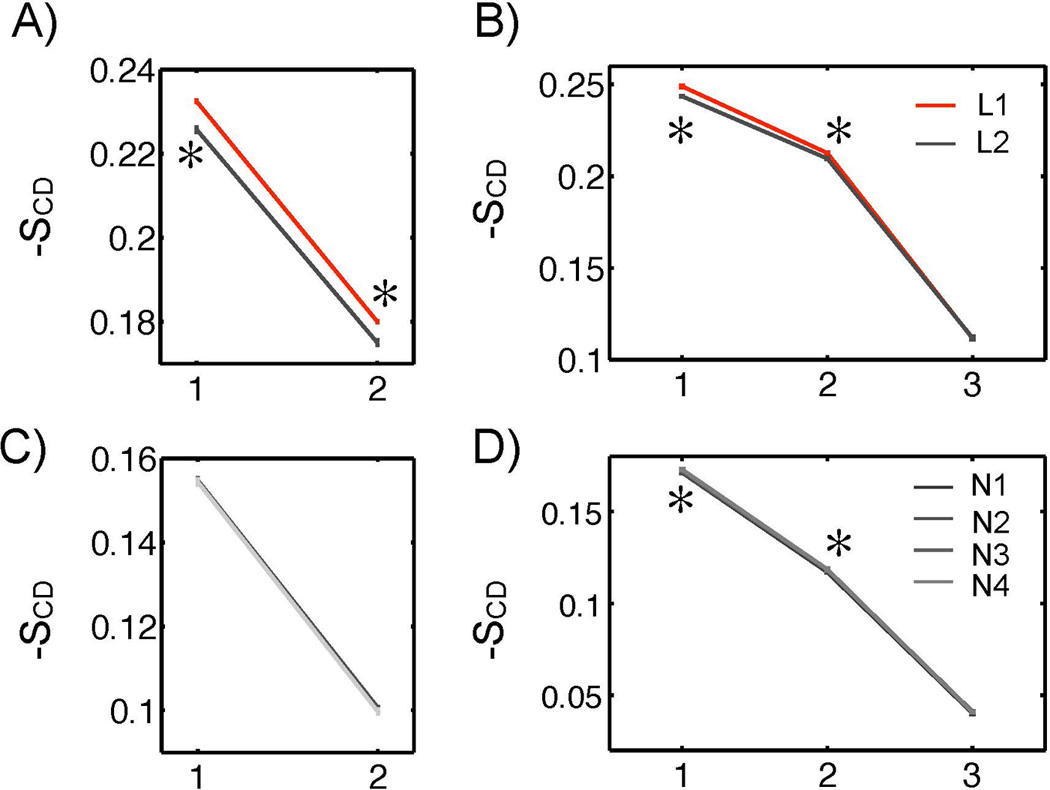
Lipid tail order parameters of liposomes and PFOB-NEPs. The lipid tail orders of sn-1 palmitoyl chain (A) and sn-2 oleoyl chain (B) of liposomes are plotted. The lipid tail orders of sn-1 palmitoyl chain (C) and sn-2 oleoyl chain (D) of PFOB-NEPs are plotted. The differences of the designated pairs are statistically significant at a 95% confidence level.