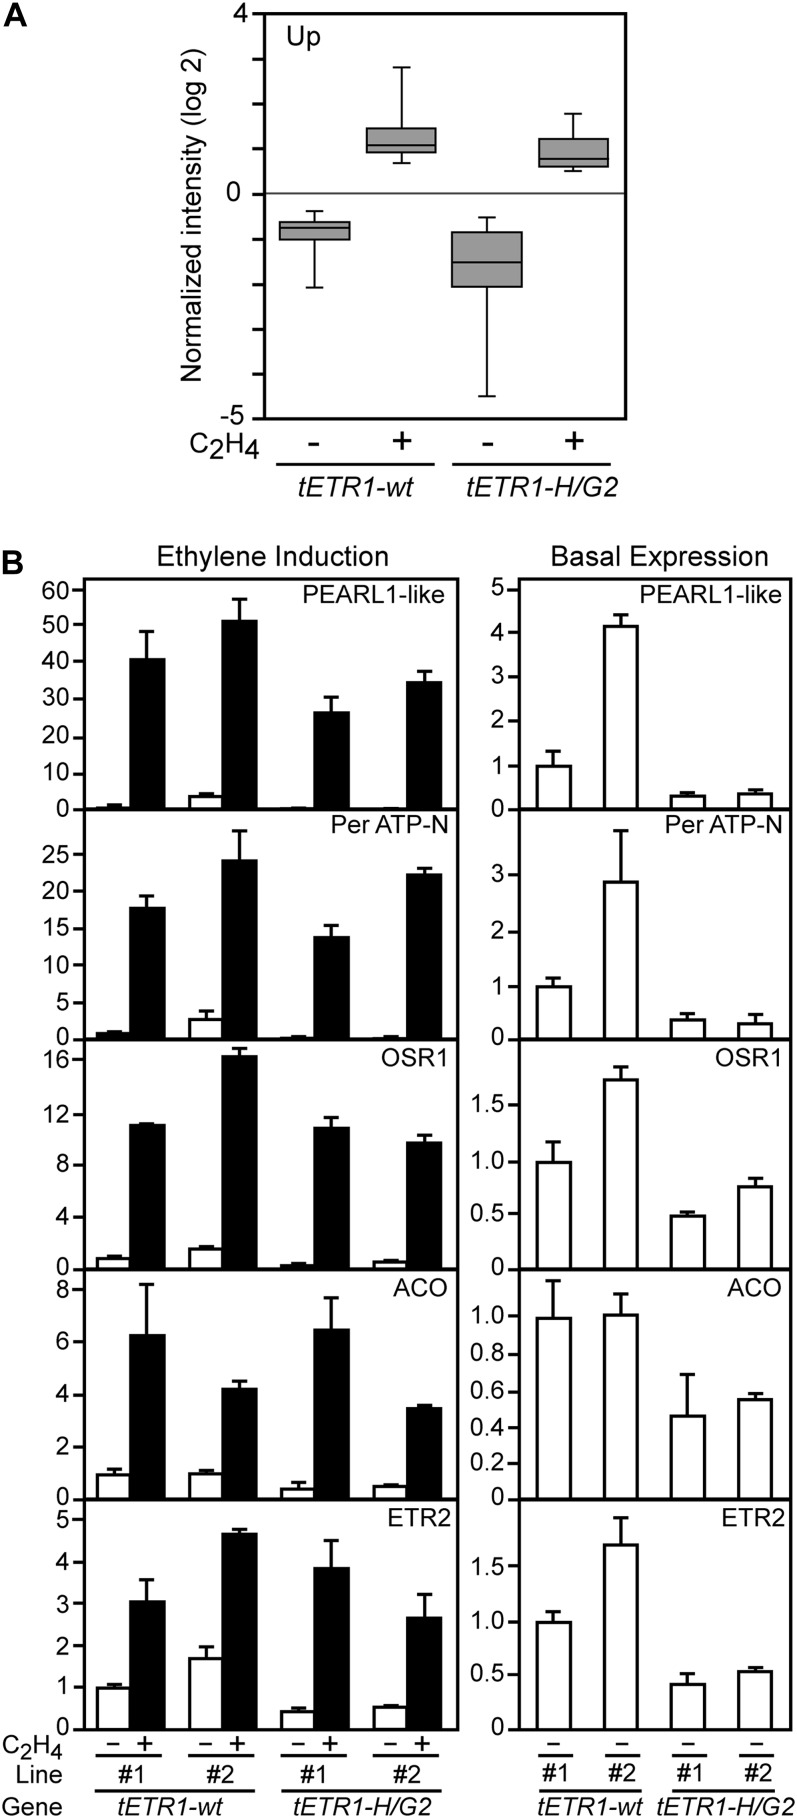
Figure 5.
Expression analysis of ethylene-induced genes. A, Box-plot analysis of microarray expression data for the genes shown in Table I. The bottom and top of each box represent the 25th and 75th percentile for data expression values, the band in the middle of the box represents the median expression value, and the ends of the box whiskers represent the minimum and maximum expression values for the data. Expression values for the box-plot analysis are log2 transformed. B, Real-time RT-PCR analysis for the expression of selected genes. Two independent lines for each of the transgenes tETR1-wt and tETR1-H/G2 were analyzed, tETR1-wt-line 2 and tETR1-H/G2-line 2 being those used for microarray analysis. The expression level of tETR1-wt-line 1 in the absence of ethylene is set to 1. The left panel for each gene shows expression in the absence and presence of 1 µL L−1 ethylene. The right panel shows just the basal level of expression in the absence of ethylene treatment, at a scale to allow for better comparison of expression.

