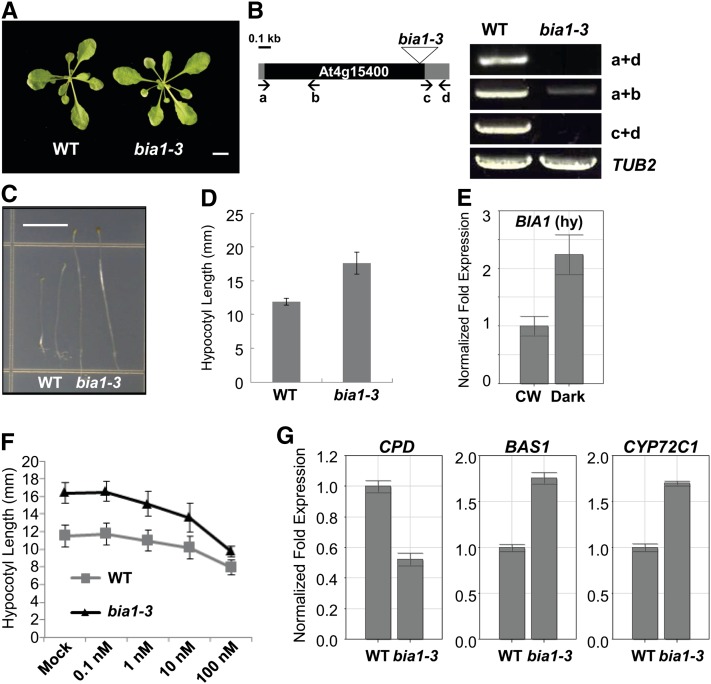
Figure 6.
Isolation of bia1-3, a loss-of-function mutant of BIA1. A, Vegetative morphology of 3-week-old wild-type (WT) and bia1-3 plants. Scale bar = 1 cm. B, The T-DNA insertion site and expression of BIA1 in the bia1-3 mutant. The triangle represents the T-DNA inserted into the BIA1 coding region. The black square represents the coding region and the gray squares mean the 5′ and 3′ untranslated regions of BIA1. RT-PCR using primers (lowercase letters and arrows) that amplify different regions of BIA1 shows that the bia1-3 mutant is a near RNA-null allele. TUB2 was used as an internal control. The number of PCR cycles was 35 for BIA1 and 22 for TUB2, respectively. C, Phenotypes of wild-type (WT), bia1-1D, and bia1-3 plants grown under dark conditions. Scale bar = 5 mm. D, Measurement of the hypocotyl lengths of 5-d-old seedlings shown in C (n ≥ 15, data represent the mean ± sd values). E, Real-time qRT-PCR of BIA1 in the hypocotyls (hy) of 4-d-old wild-type seedlings grown under continuous white light (CW) or dark conditions. The fold expression was calculated relative to the expression level in continuous white light. Error bars represent sd of three replicates. F, Exogenous BR response test of hypocotyl elongation in bia1-3 and wild-type dark-grown seedlings. n ≥ 15, and data represent the mean ± sd values. G, Real-time qRT-PCR of BR-related genes in 6-d-old dark-grown wild-type (WT) and bia1-3 seedlings. The fold expression was calculated relative to the level of the WT. Error bars represent sd of three replicates.

