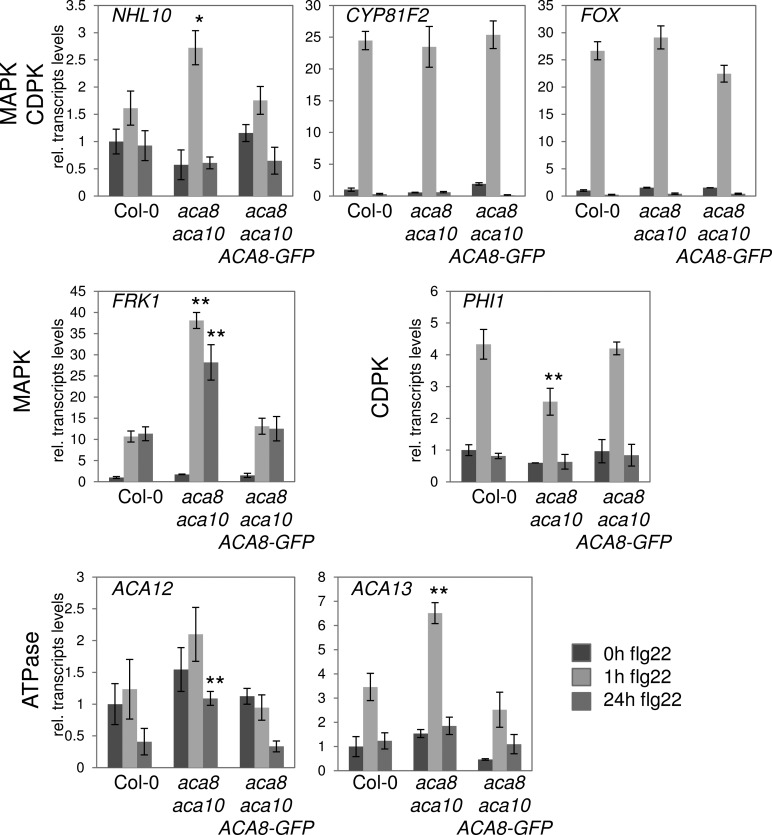
Figure 4.
flg22-induced gene expression. Quantitative real-time PCR monitoring is shown for transcript levels of flg22-regulated genes and other Ca2+ ATPases in the indicated genotypes upon flg22 elicitation. Actin was used as a control. Error bars indicate sd based on three biological experiments with three technical replicates each; asterisks indicate significant differences between Col-0 and aca8 aca10 at P < 0.05 (*) and P < 0.01 (**) based on Student’s t test. FOX, FAD-LINKED OXIREDUCTASE; FRK1, FLAGELLIN-RESPONSIVE KINASE1; NHL10, NDR1/HIN-LIKE10; PHI1, PHOSPHATE INDUCED1.

