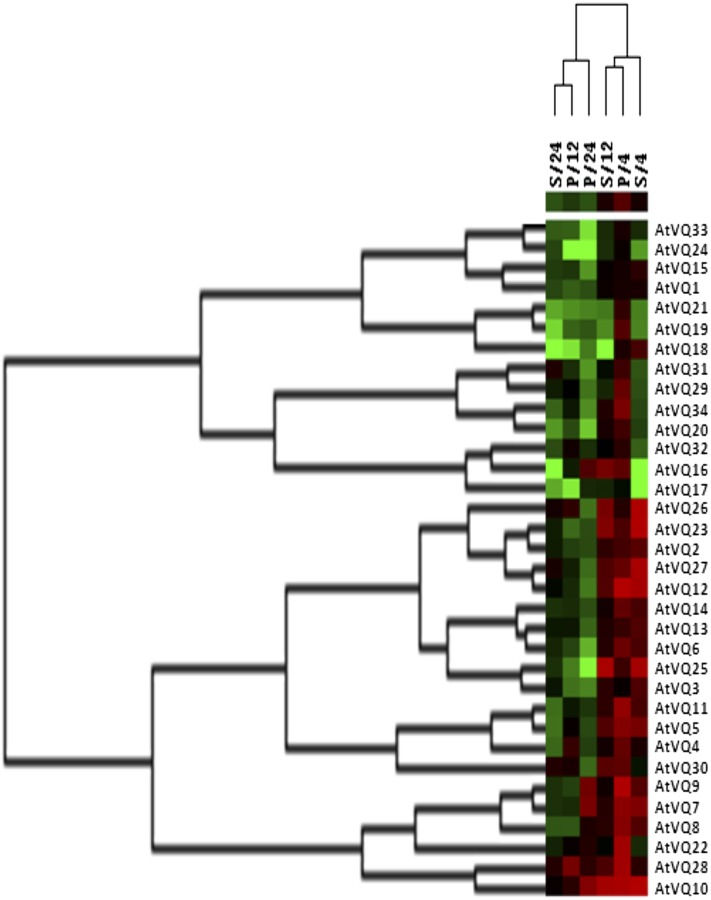
Figure 5.
Cluster analysis of the expression profiles of Arabidopsis VQ genes. VQ gene expression was determined by qRT-PCR. VQ genes are represented as rows and treatment/time point as columns in the matrix. Red, black, and green elements indicate up-regulated, no change, and down-regulated VQ genes, respectively, in the matrix. Cluster analysis was performed on expression profiles of 34 VQ genes across six transients treatments (P, P. syringae infection; S, SA treatment) and time points (4, 12, and 24 h after pathogen inoculation or SA treatment). The horizontal and vertical dendrograms indicate the degree of similarity between expression profiles for VQ genes and conditions tested, respectively.

