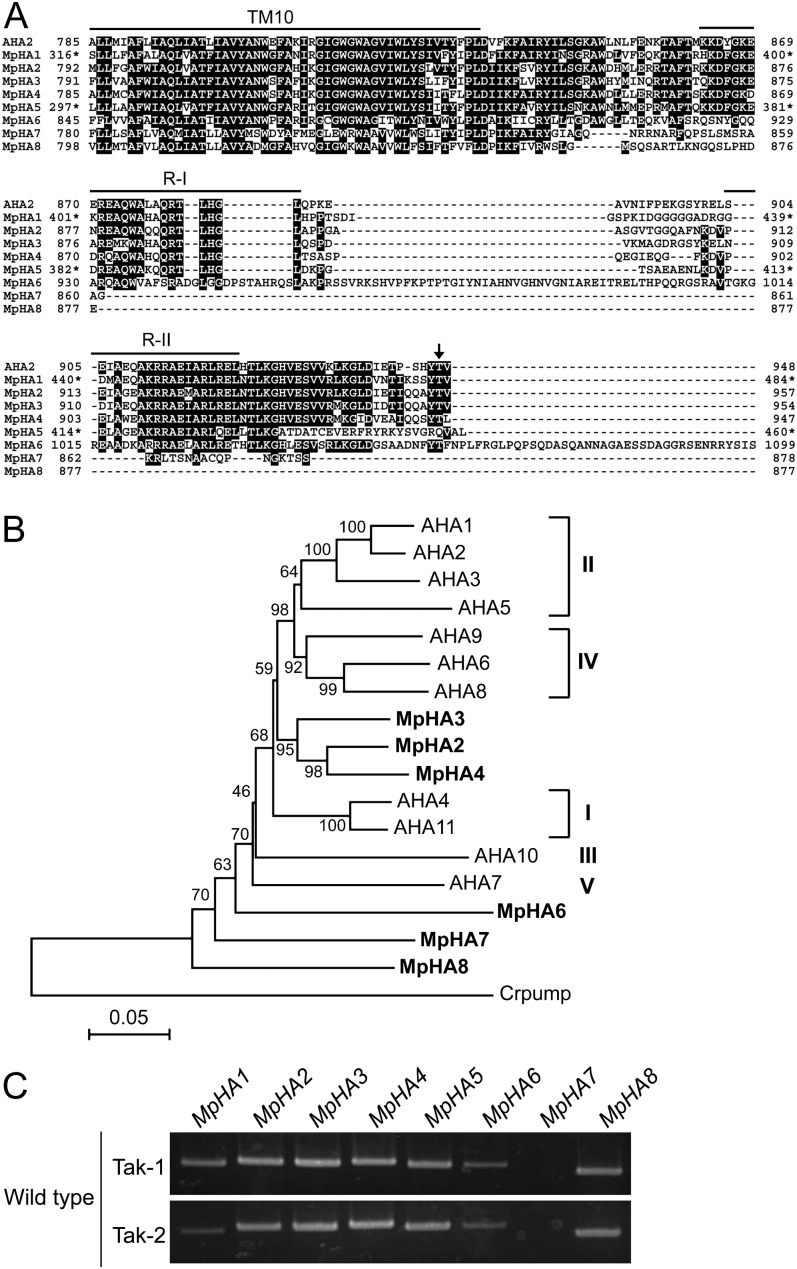
Figure 1.
Molecular characterization of the H+-ATPase in M. polymorpha. A, Alignment of C termini of the H+-ATPases from M. polymorpha (MpHA1–MpHA8) and Arabidopsis (AHA2) with ClustalW (Thompson et al., 1994). Black blocks indicate highly conserved residues. The 10th transmembrane segment (TM10) and region I (R-I) and region II (R-II) within the C-terminal region are indicated by lines. The arrow denotes the penultimate Thr of AHA2, which is the phosphorylated site for activity regulation. Asterisks indicate amino acid numbers of the partial sequences not acquiring N-terminal information for MpHA1 and MpHA5. Dashes indicate gaps introduced to allow for optimal alignment of the sequences. B, Phylogenetic tree of the H+-ATPase proteins from M. polymorpha, Arabidopsis (AHA1–AHA11), and C. reinhardtii (Crpump; XP_001698580). The alignment for the phylogenetic tree was performed with ClustalW using full-length amino acid sequences (Thompson et al., 1994). The phylogenetic tree was created with the MEGA5 software (Tamura et al., 2011) and the neighbor-joining program with 1,000 bootstrap replications. Bootstrap values at the branches represent the percentage obtained in 1,000 replications. The C. reinhardtii pump sequence was used as an outgroup. MpHA1 and MpHA5 were not used to construct the phylogenetic tree, as full-length sequences were not acquired. Roman numerals designate the subfamilies. The scale bar represents 0.05 substitutions per site. C, RT-PCR analysis of isogenes of the H+-ATPase in M. polymorpha. RNA was extracted from each thallus of the male (Tak-1) and female (Tak-2) gametophytes. PCRs were performed with 30 cycles using specific primers for MpHA1 to MpHA8.

