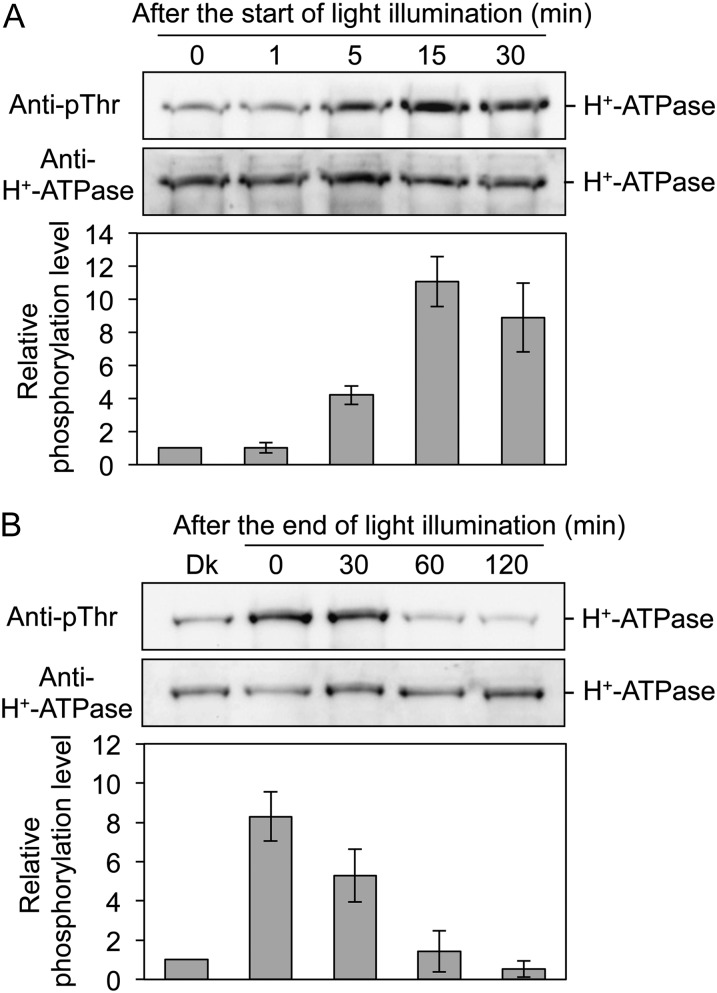
Figure 5.
Changes in phosphorylation levels of the H+-ATPase in thalli in response to light. A, Time course of phosphorylation of the H+-ATPase in response to light. Dark-adapted thalli were illuminated with white light at 50 µmol m−2 s−1 and disrupted at 1, 5, 15, and 30 min after the start of illumination. The protein extracts were subjected to SDS-PAGE. Other procedures were the same as in Figure 4A. B, Time course of dephosphorylation of the H+-ATPase at the end of illumination. Dark-adapted thalli (Dk) were illuminated with white light for 30 min at 50 µmol m−2 s−1 and kept in darkness at the end of the illumination. The thalli were disrupted at 0, 30, 60, and 120 min after the end of illumination. The protein extracts were subjected to SDS-PAGE. Other procedures were the same as in Figure 4A. The graphs represent the phosphorylation level of H+-ATPase, as quantified from the ratio of signal intensity from the phosphorylated H+-ATPase to that from the H+-ATPase and expressed relative to the phosphorylation level of the dark-adapted thalli. Values represent means of three independent experiments with sd.

