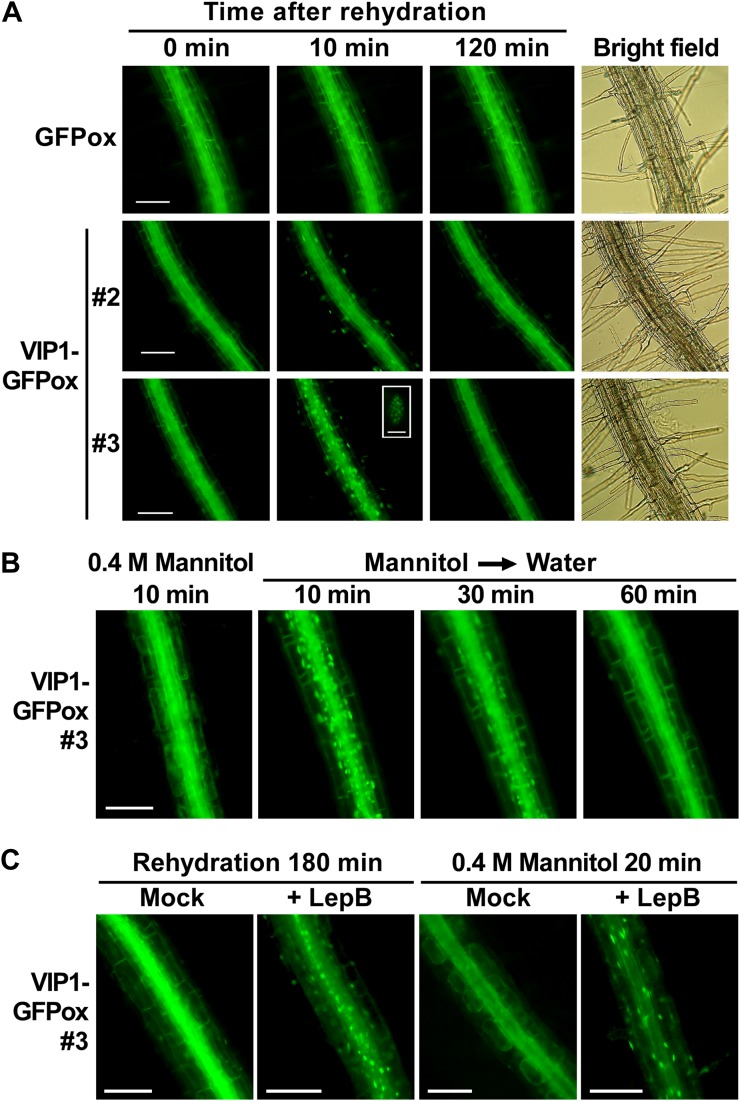
Figure 2.
Turgor-dependent translocation of VIP1-GFP. A root is shown in each image. A, Roots of GFP- or VIP1-GFP-overexpressing plants (GFPox or VIP1-GFPox, respectively) were observed by epifluorescence microscopy at the indicated time points after being submerged in 20 mm Tris-HCl, pH 6.8 (rehydration). Speckled VIP1-GFP signals in the nucleus in VIP1-GFPox #3 at 30 min after rehydration are shown as a high-magnification image (inset). Bars = 100 μm for low-magnification images and 5 μm for the high-magnification image. B, Roots of VIP1-GFPox #3 were observed 10 min after being submerged in 20 mm Tris-HCl, pH 6.8, with 0.4 m mannitol (0.4 m Mannitol 10 min). Plants were then transferred to 20 mm Tris-HCl, pH 6.8, without mannitol (Mannitol → Water) and observed at the indicated time points. Bar = 100 μm. C, Roots of VIP1-GFPox #3 were observed 180 min after being submerged in 20 mm Tris-HCl, pH 6.8 (rehydration), containing 0 (Mock) or 2 μg mL−1 leptomycin B (+ LepB), or 20 min after being submerged in 0.4 m mannitol, 20 mm Tris-HCl, pH 6.8, containing 0 or 2 μg mL−1 leptomycin B. Bars = 100 μm.

