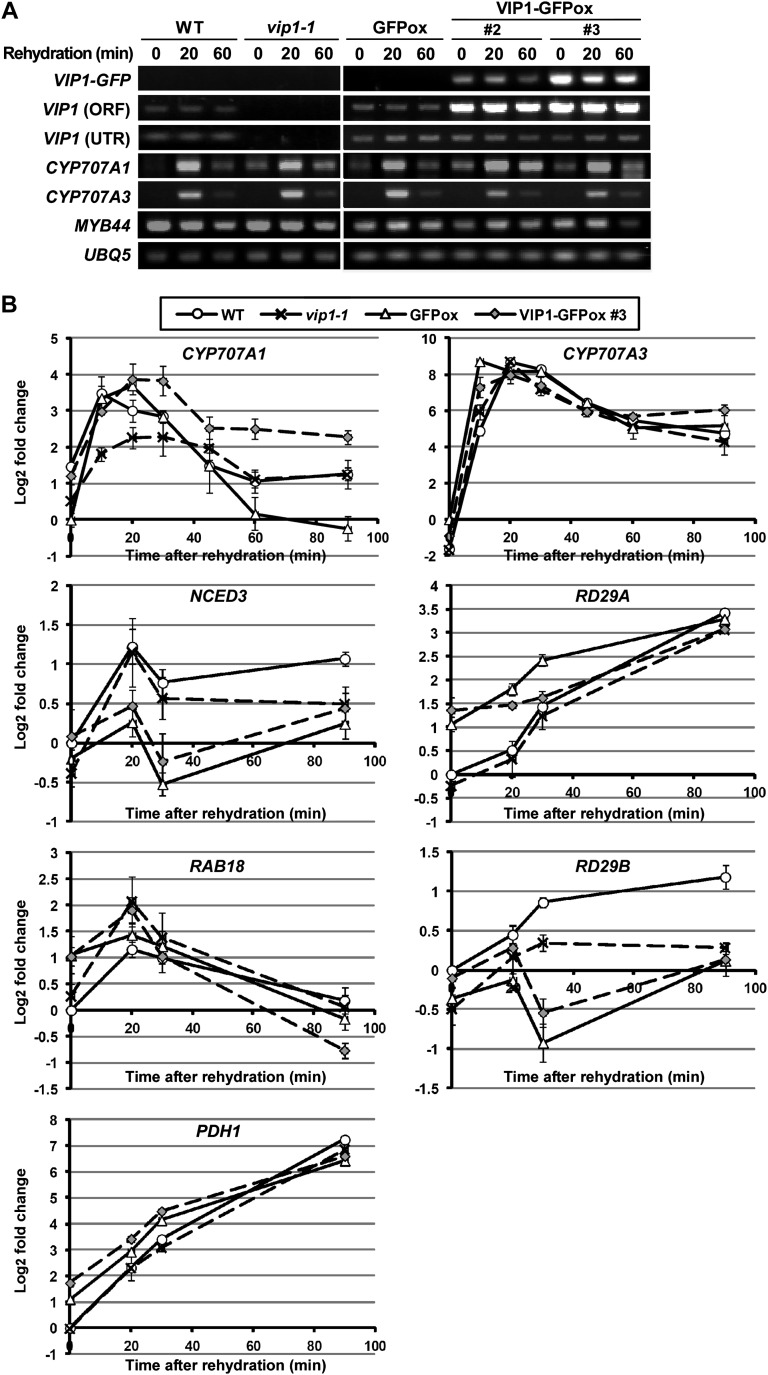
Figure 7.
RT-PCR analyses of gene expression. A, Semi-qRT-PCR analysis of gene expression in vip1-1 and VIP1-GFPox plants. Two-week-old seedlings of each genotype were submerged in 20 mm Tris-HCl (rehydration) for 0, 20, and 60 min and sampled for RNA extraction and cDNA synthesis. For VIP1 (ORF), a primer pair specific to the ORF of VIP1 was used. For VIP1 (UTR), a reverse primer specific to the 3′ untranslated region of VIP1 was used. UBQ5 was used as an internal control gene. B, Real-time qRT-PCR analysis of the expression of dehydration-, rehydration-, and ABA-responsive genes. Two-week-old seedlings of each genotype were submerged in 20 mm Tris-HCl (rehydration) for 0, 10, 20, 30, 45, 60, and 90 min and sampled for RNA extraction and cDNA synthesis. Relative expression levels were calculated by the comparative cycle threshold method using UBQ5 as an internal control gene and are shown as log2 fold changes. Experiments were performed in triplicate. Values are means ± se. WT, Wild type.

