Figure 8.
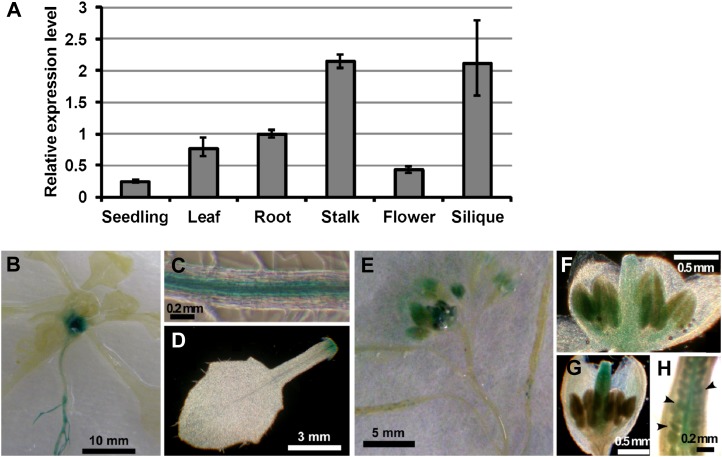
Stage and tissue specificity of VIP1 expression. A, qRT-PCR analysis of VIP1 transcripts in various tissues. Relative expression levels were calculated by the comparative cycle threshold method using UBQ5 as an internal control gene and a root sample as a reference sample. Experiments were performed in triplicate. Values are means ± se. B to H, Histochemical GUS staining of transgenic Arabidopsis carrying VIP1 promoter-GUS. B, A 20-d-old plant. C, Mature leaf. D, Root. E, Flowers and siliques. F and G, Developing flowers. H, Pistil. Arrowheads indicate developing embryos.

