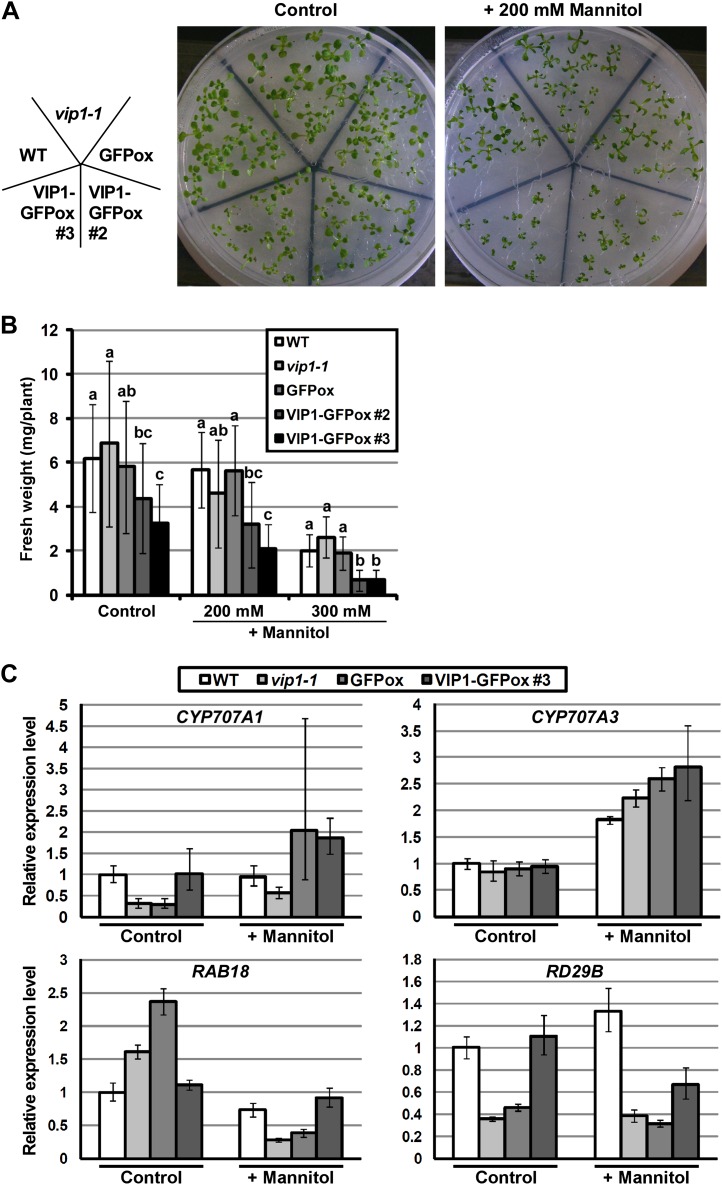
Figure 9.
Responses of VIP1-GFPox to mannitol stress. A, Images of 2-week-old plants grown on medium with 0 (Control) and 200 mm mannitol. B, Fresh weights of 2-week-old plants grown on medium in the presence of 0 (Control), 200, and 300 mm mannitol. Values are means ± se (n = 11–16). Means marked with the same letter are not significantly different (P < 0.05) based on an ANOVA test. C, Expression levels of CYP707A1/3 and ABA-responsive genes under mannitol stress. Plants were grown for 3 weeks on medium with 0 (Control) and 200 mm mannitol (+ Mannitol) and used for RNA isolation and cDNA synthesis. Relative expression levels were calculated by the comparative cycle threshold method using UBQ5 as an internal control gene and a sample of the wild type (WT) grown under the control condition as a reference sample. Experiments were performed in triplicate. Values are means ± se.

