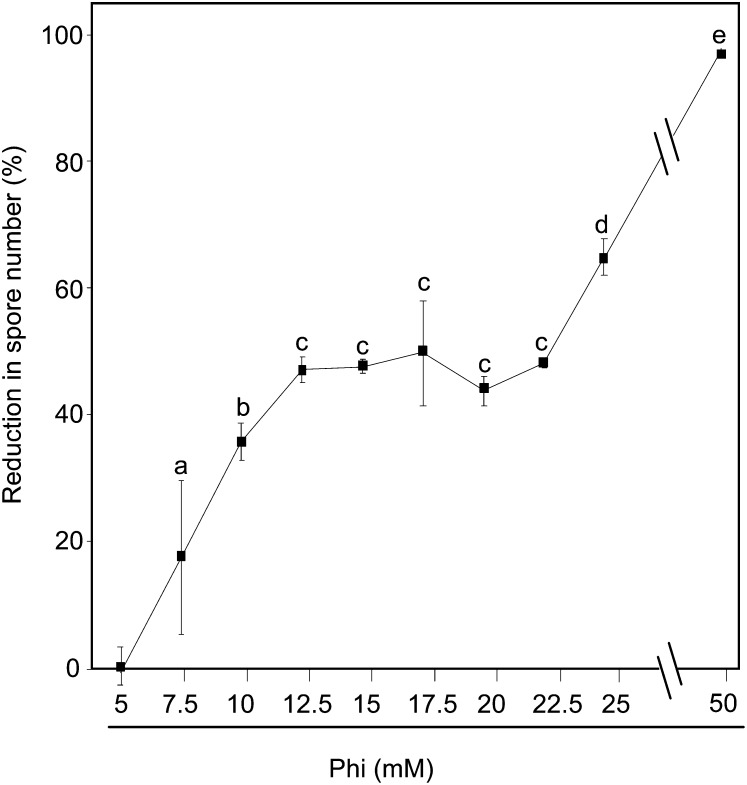
Figure 2.
Dose-response curve of Phi toward Hpa. Col-0 wild-type plants were treated and inoculated by Hpa isolate Noco2 as described in the legend of Figure 1. The effectiveness of Phi was calculated as a percentage of the reduction in spore number caused by Phi treatment. Values are means ± se of nine replicates from three biological independent experiments. Letters indicate significant differences between values (ANOVA, Newman-Keuls test; P < 0.05).

