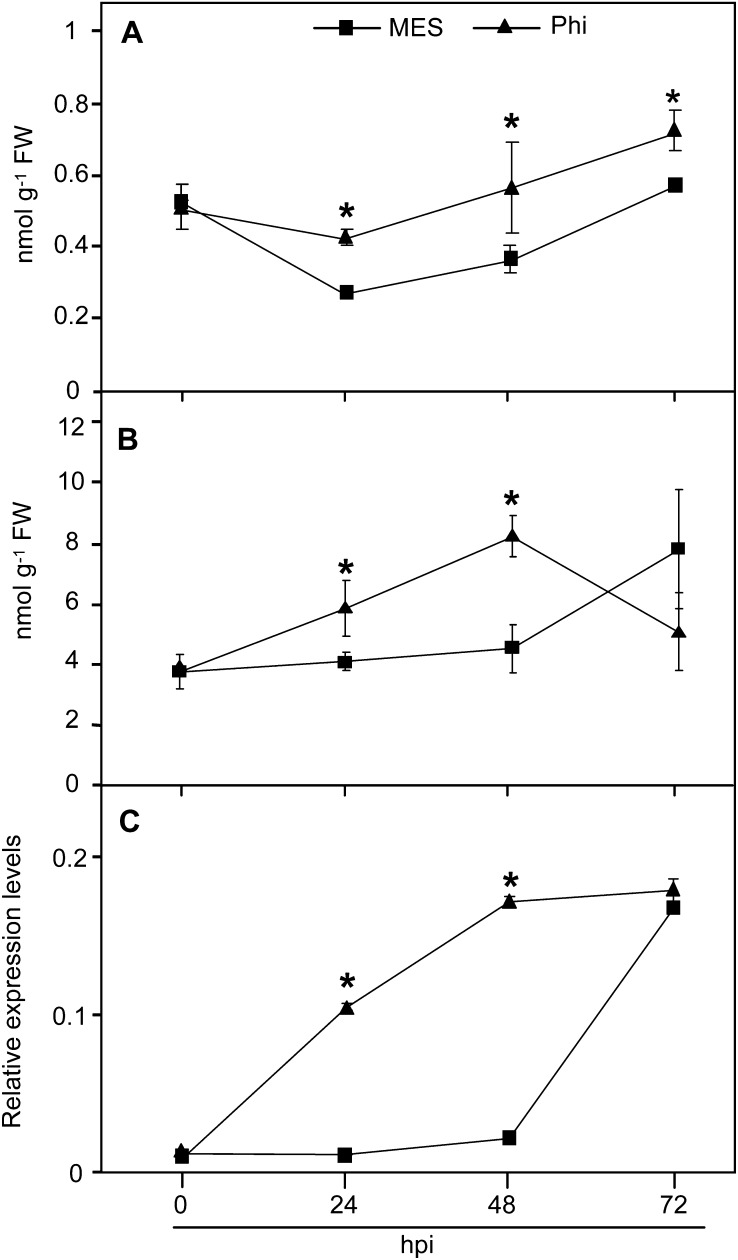
Figure 4.
Effects of Phi treatment on the accumulation of SA and PR1 transcripts in Arabidopsis in response to Hpa. Col-0 wild-type plants were treated and inoculated as described in the legend of Figure 3. A, Accumulation of free SA. B, Accumulation of total SA. C, Accumulation of PR1 transcripts normalized to the transcript level of the internal control gene ACTIN2. Levels of SA and PR1 transcripts were quantified by HPLC and qRT-PCR, respectively. Values in graphs are means ± sd of three replicates. The experiments were repeated twice with similar results. Asterisks indicate data that are significantly different between Phi and MES treatments (Mann-Whitney test; P < 0.05). FW, Fresh weight.

