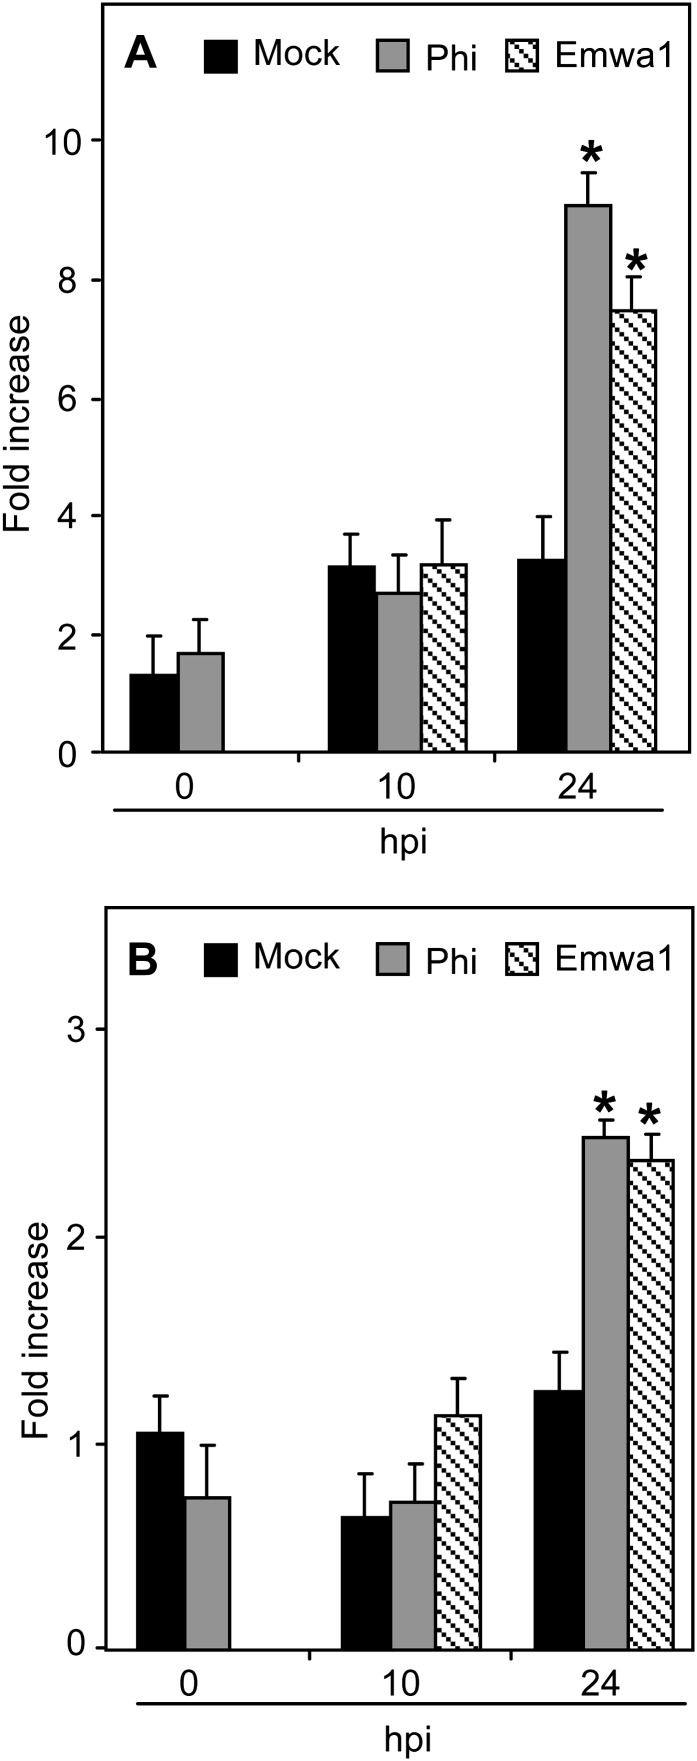
Figure 6.
Effects of Phi treatment on PAD4 and EDS1 expression in Arabidopsis in response to Hpa. A, PAD4 expression. B, EDS1 expression. Plants were treated and inoculated as described in the legend of Figure 3. Samples were harvested at 0 h (before chemical treatment), 0 hpi (72 h post treatment), and 10 and 24 hpi. Levels of PAD4 and EDS1 transcripts were quantified by qRT-PCR, normalized to the level of the internal control gene ACTIN2, and expressed relative to their levels at 0 h. For inoculation with Emwa1, plants were pretreated with MES. For each time point, values are means ± sd of three replicates. Asterisks indicate significant differences between values (ANOVA, Newman-Keuls test; P < 0.05). The experiments were repeated three times with similar results.

