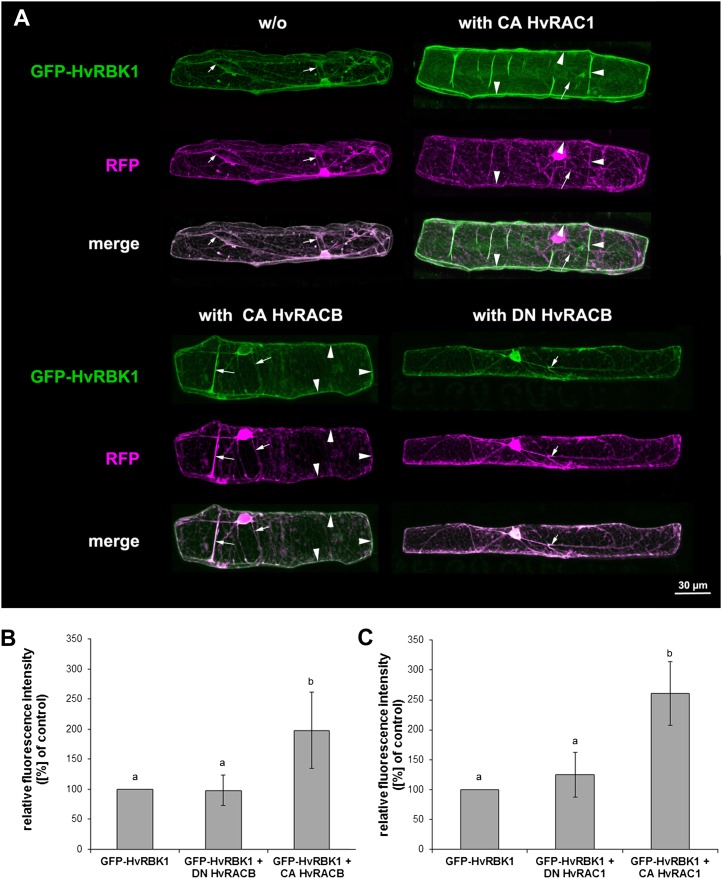
Figure 4.
Recruitment of GFP-HvRBK1 by HvROPs in barley epidermal cells. A, Subcellular localization of GFP-HvRBK1 in epidermal cells of barley. A, Confocal laser-scanning micrographs of barley epidermal cell expressing GFP-HvRBK1 (green) and RFP (magenta). Soluble RFP was cotransformed as marker for cytoplasmic and nuclear localization. White color in the merged channels demonstrates similar localization of GFP-HvRBK1 and RFP in cytoplasmic strands (arrows). GFP-HvRBK1 was expressed alone (−/−) or together with the unlabeled HvROPs CA HvRACB, CA HvRAC1, or DN HvRACB. Coexpression of GFP-HvRBK1 and CA HvRACB or CA HvRAC1 results in recruitment of GFP-HvRBK1 to the cell periphery/plasma membrane (arrowheads) as demonstrated by color separation and the green cell periphery in the fluorescent merged pictures. DN HvRACB does not alter cytoplasmic localization of GFP-HvRBK1. Pictures are maximum projections of 20 to 30 optical sections at 2-μm increments. B and C, Fluorescence intensity of GFP-HvRBK1 at the cell periphery is greatly modified upon coexpression of different HvROPs. To quantify recruitment of GFP-HvRBK1 by CA HvRACB and CA HvRAC1, both proteins were coexpressed with GFP-HvRBK1 and mCherry as a marker for cytoplasmic and nuclear localization. As negative control, CA HvROP variants were replaced by DN HvRACB or DN HvRAC1. Additionally, the GFP-HvRBK1 was expressed with mCherry and empty vector as control. Mean pixel intensity was measured at the cell periphery and normalized against mCherry pixel intensity in the nucleus. Columns show means of three independent experiments with 95% confidence intervals as error bars. Intensities were significantly different between the CA HvRACB or CA HvRAC1 expressing cells versus the respective controls after ANOVA (Tukey test, P < 0.05, as indicated by different letters in the figure).

