Figure 1.
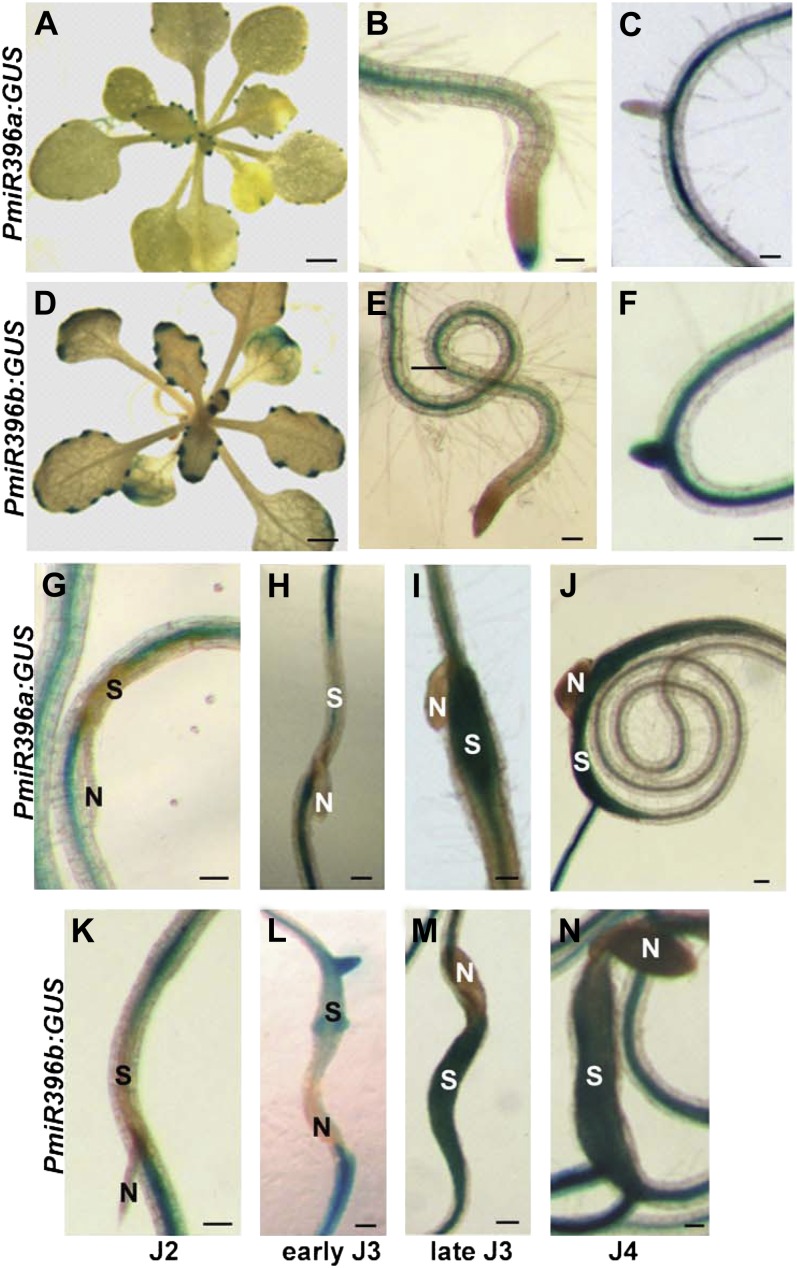
Histochemical localization of GUS activity directed by miR396 promoters. A to F, Spatial expression patterns of miR396a and miR396b. A to C, GUS staining of miR396a:GUS plants showing expression in leaf hydathodes (A), vascular root tissues and the root cap (B), and absence of expression in the emerging lateral roots (C). D to F, GUS staining of miR396b:GUS plants showing expression in leaf hydathodes (D), vascular root tissues (E), and emerging lateral roots (F). G to N, Promoter activity of miR396a and miR396b during H. schachtii infection. Time-course experiments compared the expression of PmiR396a:GUS (G–J) and PmiR396b:GUS (K–N) transgenic plants at the second-stage (J2), early and late third-stage (J3), and fourth-stage (J4) juvenile time points. N indicates nematode, and S indicates syncytium. Bars = 2 mm in A and D and 100 µm in B, C, and E to N.

