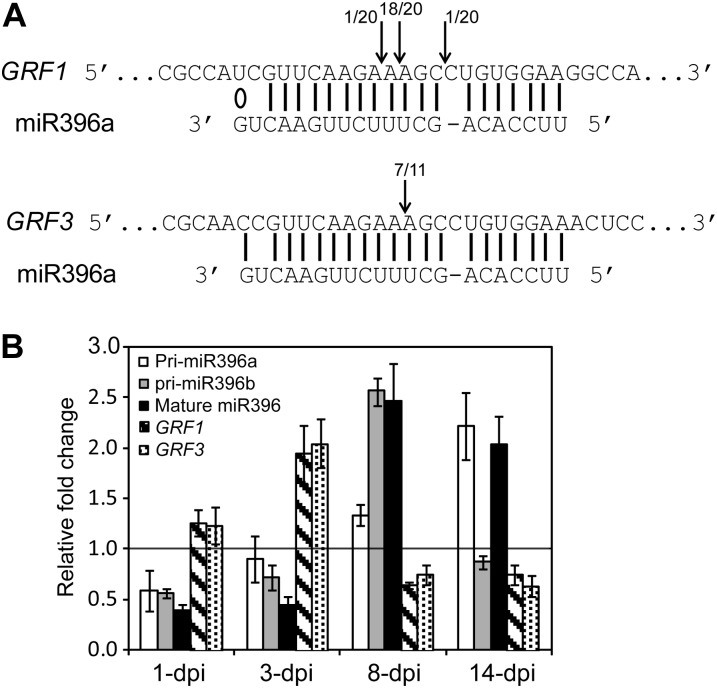
Figure 3.
Posttranscriptional regulation of GRF1 and GRF3 by miR396 in response to H. schachtii infection. A, Mapping of the cleavage sites of GRF1 and GRF3 using 5′ RLM-RACE. Arrows indicate the positions of cleavage sites in the sequenced 5′ RACE clones. The number of clones corresponding to each cleavage site is indicated. Perfect base pairing between miR396 and GRF1 and GRF3 mRNA is shown by vertical lines, and G:U wobble pairing is indicated by a circle. B, miR396 mediates the down-regulation of GRF1 and GRF3 expression in response to H. schachtii infection. The expression level of pri-miR396a, pri-miR396b, mature miR396, GRF1, and GRF3 was measured by qPCR in wild-type (Col-0) root tissues. Infected and noninfected tissues were collected at 1, 3, 8, and 14 dpi. Down-regulation of miR396 at 1 and 3 dpi was associated with up-regulation of both GRF1 and GRF3. In contrast, up-regulation of miR396 at 8 and 14 dpi was associated with low transcript accumulation of GRF1 and GRF3. U6 small nuclear RNA was used as an internal control to normalize the expression levels of miR396, whereas Actin8 was used to normalize the expression levels of GRF1 and GRF3. The relative fold-change values represent changes of the expression levels in infected tissues relative to noninfected controls. Data are averages of three biologically independent experiments ± se.

