Figure 2.
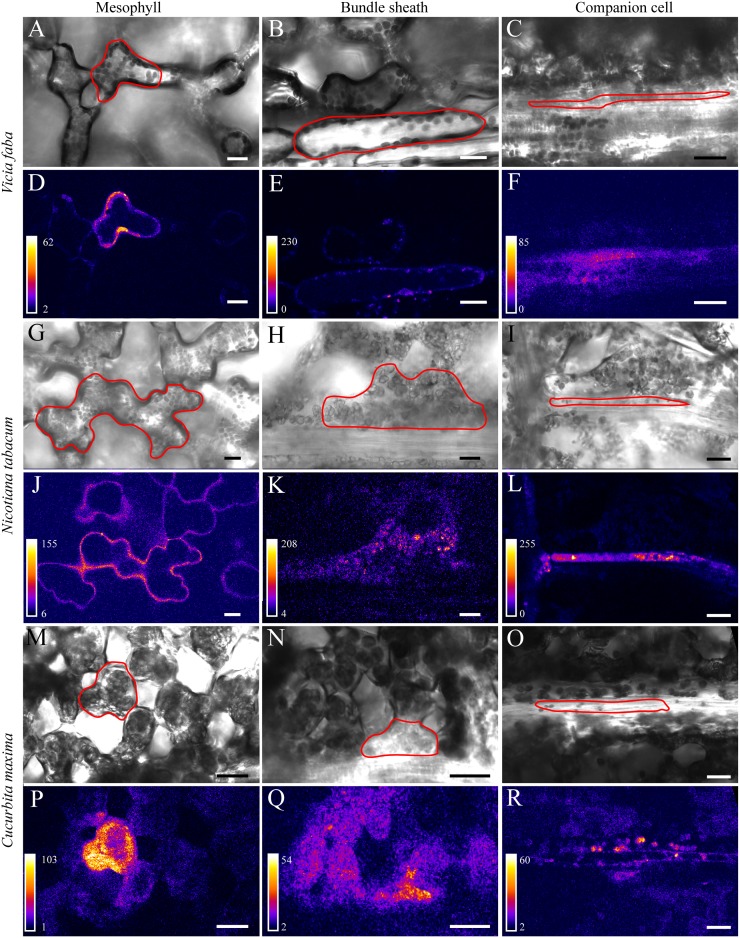
Postphotoactivation images from photoactivation experiments in V. faba (A–F), N. tabacum (G–L), and C. maxima (M–R). The respective target cells are outlined in the bright-field images (A–C, G–I, and M–O) that correspond to the fluorescence images shown directly below (D–F, J–L, and P–R). The first column of images shows photoactivation in MCs, the second column shows photoactivation in BSCs, and the third column shows photoactivation in CCs. In N. tabacum, GFP fluorescence is present in the CC in addition to tracer fluorescence (L), which can be subtracted and therefore does not influence the calculation of cell coupling. Note that only minor amounts of tracer signal are visible in neighboring BSCs after photoactivation in CCs in the apoplasmic loader V. faba (F) and N. tabacum (L), whereas more fluorescence is visible in the symplasmic loader C. maxima (R). Bars = 20 µm.

