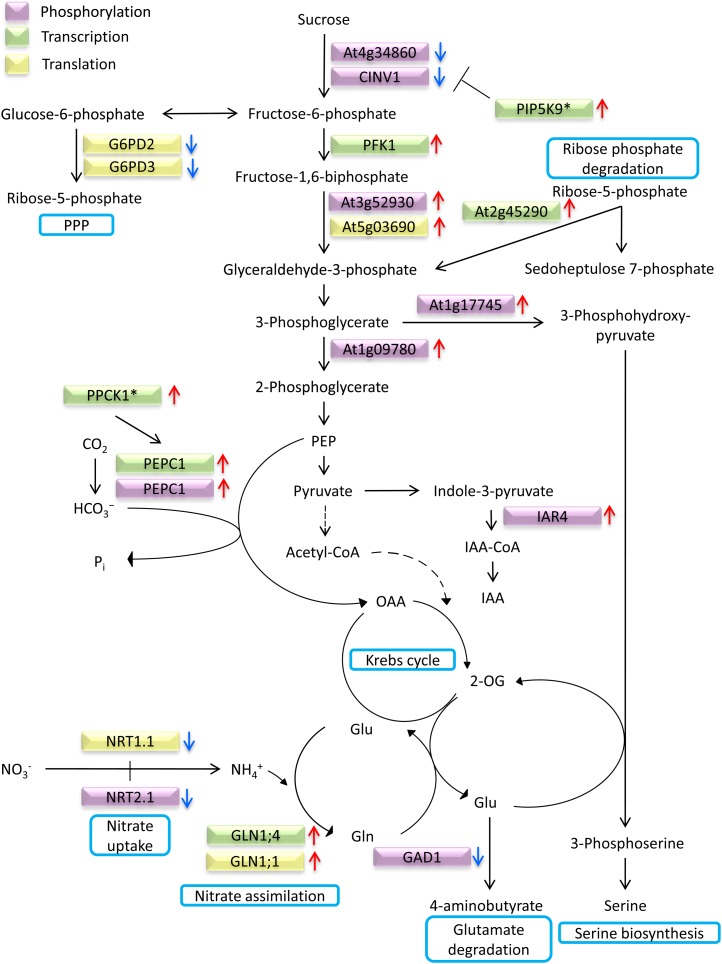
Figure 4.
Fe deficiency-induced alterations in carbohydrate metabolism at different regulator levels. Up-pointing arrows indicate up-regulated processes, and arrows pointing downward denote down-regulated processes. See text for details. Asterisks indicate genes that were significantly up-regulated more than 1.5-fold but less than 2-fold. Protein data were taken from Lan et al. (2011); transcript changes from Yang et al. (2010). OAA, Oxaloacetate; 2-OG, 2-oxoglutarate; PEP, phosphoenolpyruvate; PPP, pentose phosphate pathway.

