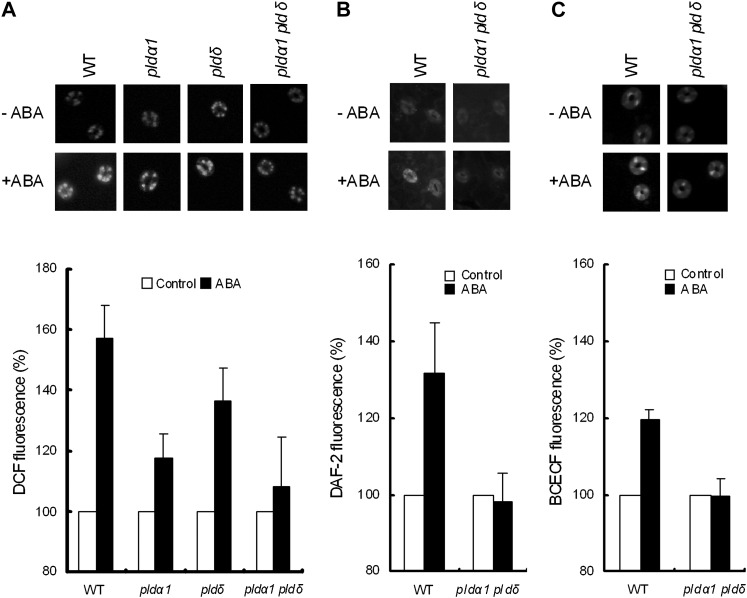
Figure 4.
Effects of ABA (50 μm) on ROS production, NO production, and cytosolic alkalization in the wild type (WT) and pld mutants. A, Representative gray-scale DCF fluorescence images (top panel) and ROS production as shown by DCF fluorescence in the wild type, pldα1, pldδ, and pldα1 pldδ (bottom panel). B, Representative gray-scale DAF-2 images (top panel) and NO production as shown by DAF-2 fluorescence (bottom panel). C, Representative BCECF images (top panel) and cytosolic alkalization as shown by BCECF fluorescence (bottom panel). In each graph, fluorescence intensity was normalized to the control values. Bars indicate averages of three independent experiments (60 guard cells per bar). Error bars represent se.

