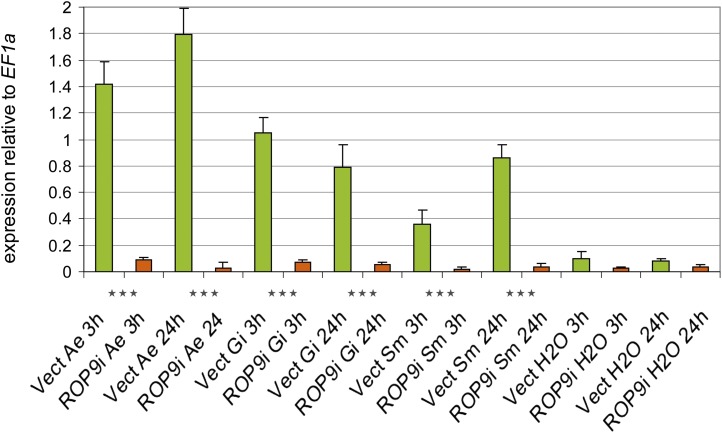
Figure 1.
Relative expression of MtROP9 in MtROP9i and Mtvector transgenic roots after A. euteiches (Ae), G. intraradices (Gi), and S. meliloti (Sm) infection at 3 and 24 hpi (RT-quantitative real-time PCR). The data shown represent averages and se of five biological replicates. Expression rates for MtROP9i are presented as orange bars and those for Mtvector as green bars. Data are standardized for the abundance of the EF1α transcripts. Asterisks indicate levels of significance by Student’s t test on all values evaluated for MtROP9i, Mtvector, and Mtwt: *** P < 0.001. [See online article for color version of this figure.]

