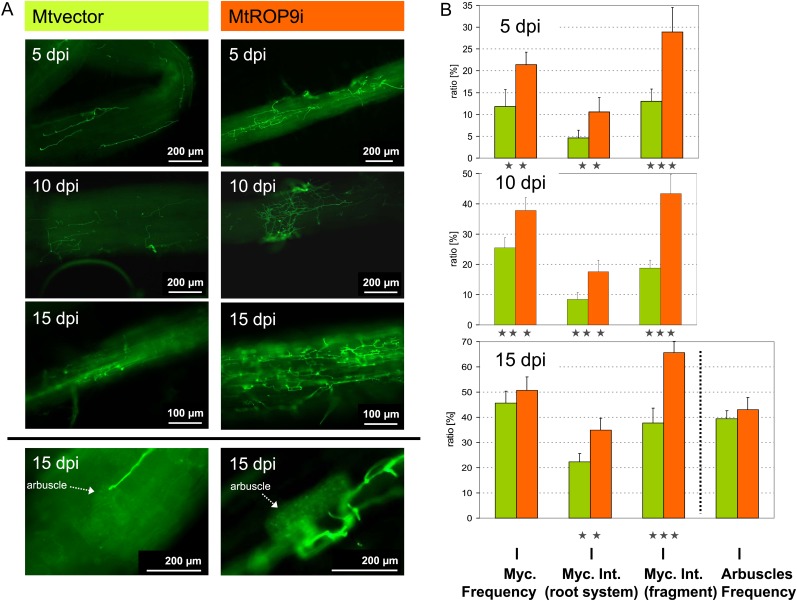
Figure 6.
Fluorescence microscopic characterization of G. intraradices infection in MtROP9i and Mtvector transgenic roots at 5, 10, and 15 dpi. A, Mycorrhizal hyphal structures are WGA-Alexa Fluor 488 stained. B, Ratios of mycorrhization (Myc.) frequency (and arbuscle frequency at 15 dpi), mycorrhization intensity (Int.) in the whole root system, and the intensity in infected root fragments. Asterisks indicate levels of significance by Student’s t test on all values evaluated for Mtvector and MtROP9i: *** P < 0.001, ** P < 0.01. [See online article for color version of this figure.]

