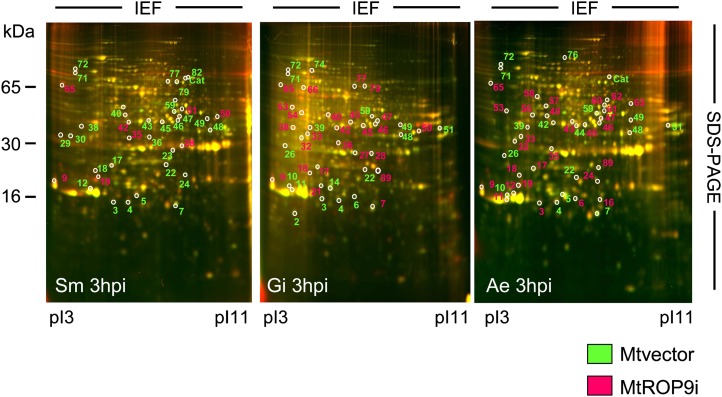
Figure 8.
Root proteome maps from 2D-DIGE analyses for MtROP9i and Mtvector root tissue at 3 h post infection with S. meliloti (Sm), G. intraradices (Gm), and A. euteiches (Ae). Differentially induced proteins are numbered as annotated for Mtwt infections according to Schenkluhn et al. (2010). Proteins induced in the Mtvector roots appear fluorescent green in the gel image and are labeled green; proteins induced in the MtROP9i roots appear fluorescent red in the gel image and are labeled red. IEF, Isoelectric focusing. [See online article for color version of this figure.]

