
FIG 2.
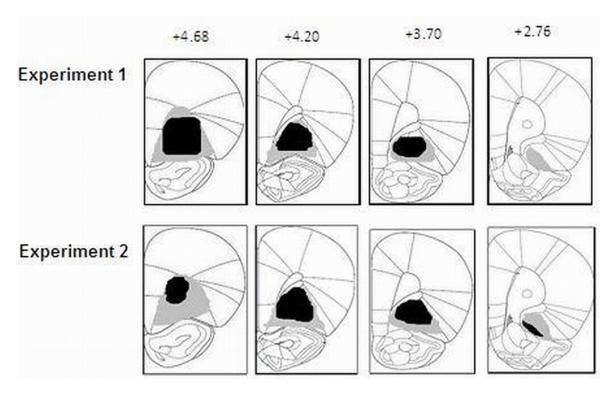
OFC histology results for Experiments 1 (top panel) and 2 (bottom panel). Diagrams of coronal sections (40 $M slices) illustrating the extent of the OFC lesions ranging from 4.68 to 2.76 mm (anterior to bregma). The drawings illustrate the approximate extent of the lesions. The black areas represent minimum lesion and the grey areas represent the areas of maximum lesions. Images adapted from Paxinos and Watson