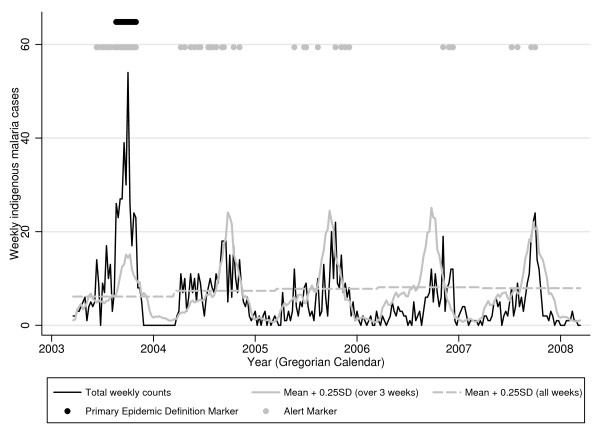
Figure 1.
Weekly indigenous malaria counts in Chabahar City (21 Mar 2003-19 Mar 2008). When weekly case counts (black line) exceed both the mean of baseline counts in the surrounding 3 weeks plus 0.25 standard deviations (solid grey line) and also exceed the mean over all weeks in the baseline plus 0.25 standard deviations (dashed grey line), an alert is triggered (grey dots at top of graph). The epidemic weeks according to the primary definition (weekly smoothed log counts exceeded both weekly and annual means plus 1 standard deviation for at least 4 weeks) are marked with black dots at the top of the graph.

