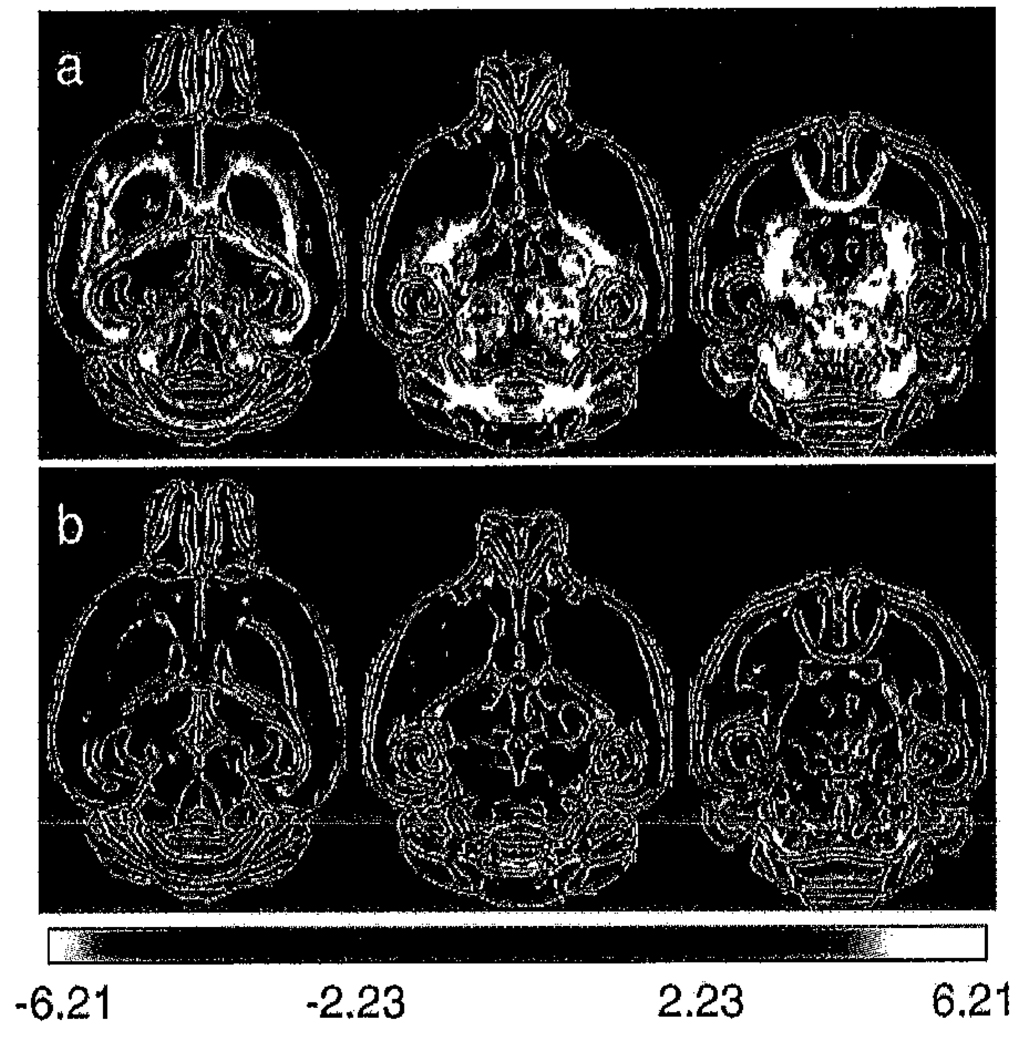
Fig. 3.
Maps of the Student’s t statistic for the (shiverer-control) difference in (a) Tr(D) and (b) FA of the apparent diffusion tensor shown in Figs. 2 and 6. The t statistic is shown overlaid on the edge-detected mean iDWI for the control group. The colorscale is red–yellow for positive differences and blue–white for negative differences and has been constrained to the range 2.23 < |t| < 6.21 (0.05 > P > 0.0005, two-tailed). Many white matter tracts, including but not limited to the external and internal capsule, fomix, anterior commisure and optic tract demonstrate significant increases in Tr(D) in the shiverer brain. The plexiform and glomerular layers of the olfactory bulb in shiverer appear to have a significantly decreased Tr(D). The low sensitive of FA to dysmyelination effects is confirmed in the t statistic map. Widespread significant FA differences are not observed in the thalamus, midbrain and brainstem.

