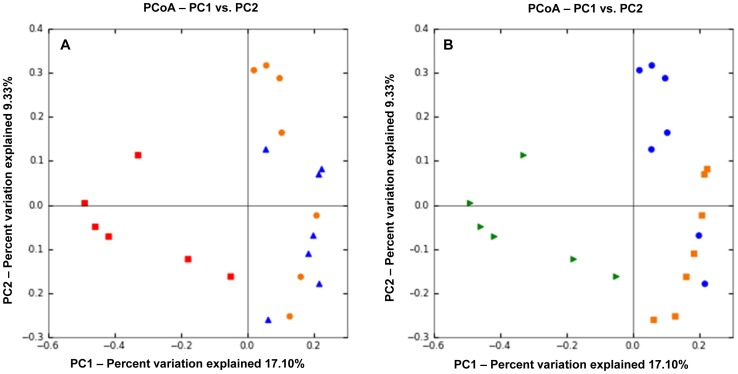
Figure 3. Principal Coordinates Analysis (PCoA) of unweighted UniFrac distances of 16 S rRNA genes.
The clustering indicates differences in microbiota composition between controls and dogs with IBD. The analysis was performed on a randomly selected subset of 840 sequences per sample. Because the samples clustered along Principal Coordinates (PC) 1 and PC 2, only these graphs are shown. A – Analysis according to clinical severity of disease based on the Canine Inflammatory Bowel Disease Activity Index (CIBDAI). Control dogs (red) separated from dogs with idiopathic inflammatory bowel disease (IBD; blue = moderate CIBDAI; orange = severe CIBDAI) indicating differences in microbiota ecology. No clustering is observed according to the severity of clinical disease. B – Analysis according to severity of histopathology. Control dogs with normal histology (green) separated from dogs with idiopathic inflammatory bowel disease (IBD; blue = mild changes on histology; orange = moderate-to-severe changes on histology). A trend was observed for separation between dogs with mild and dogs with moderate-to-severe histological changes (ANOSIM, p = 0.07).

