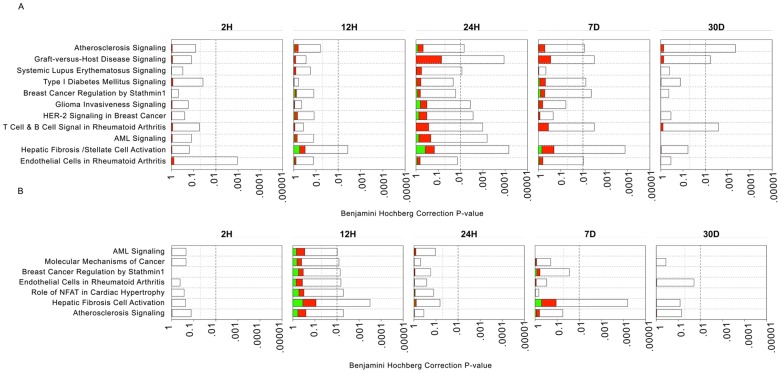
Figure 4. Analysis of disease-related pathways enrichment in vein grafts at different time-points. A.
) EC, B) SMC: Each panel denotes the effect on disease pathways at particular time-points after graft implantation. Each bar represents a pathway with significance of enrichment determined using the Benjamini-Hochberg hypothesis corrected p-value (shown on primary X-axis). The directionality of the genes in each pathway is depicted using a pseudocolor (red for up-regulated genes, green for down-regulated genes and clear for unmodified genes).

