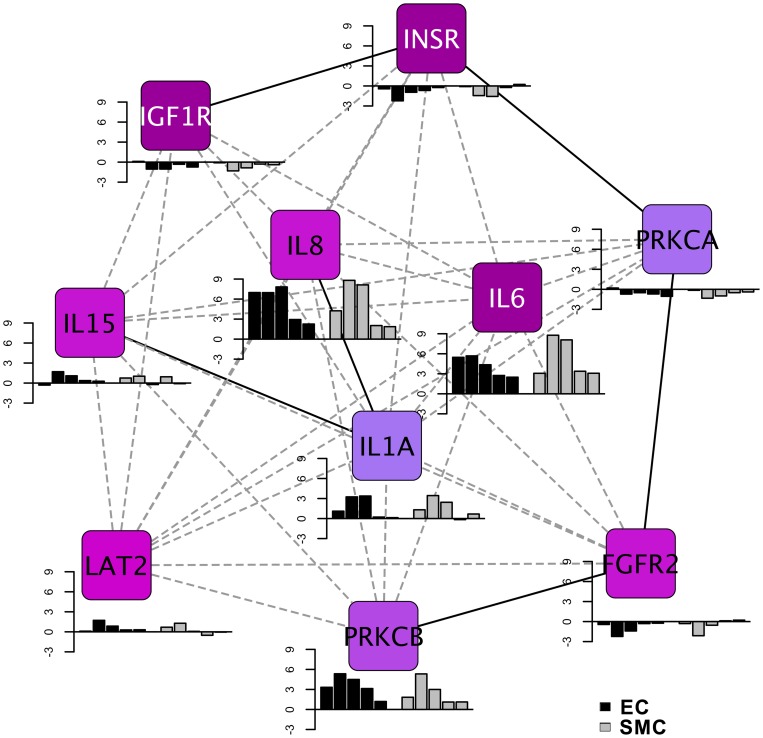
Figure 6. Signature network of vein graft implantation injury.
The network represents top ten focal gene hubs identified using density of maximum neighborhood component (DMNC) from backpropagation interaction network. The pseudocolor scale from violet to blue represents the DMNC rank from 1–10. DMNC rank is a level of significance with smaller rank indicating increasing confidence of criticality for network functioning. The bar graphs represent fold change for each focal gene hub in EC and SMC. Fold change of temporal data (2, 12 and 24 H, and 7 and 30 D) of EC and SMC is depicted by black and grey colored bars respectively.

