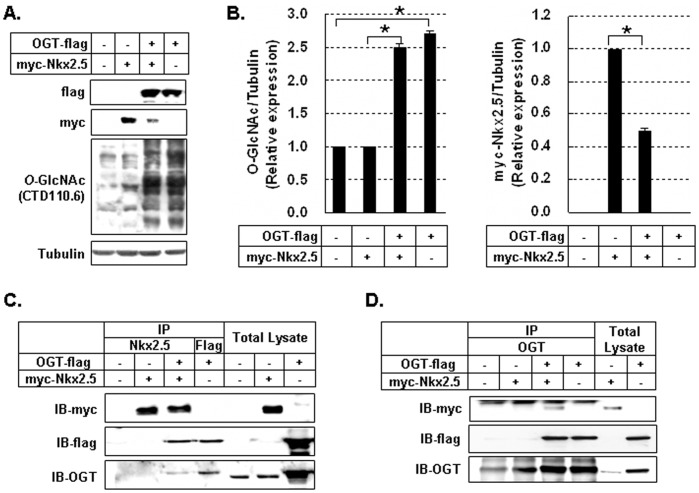
Figure 3. Interaction of Nkx2.5 and O-GlcNAc transferase (OGT).
(A) Immunoblotting analysis of myc-Nkx2.5 and O-GlycNAcylated proteins in myc-Nkx2.5 and OGT-flag-co-transfected HEK293 cells. (B) Graphs showed relative O-GlcNAc (left) and myc-Nkx2.5 (right) levels normalized to the tubulin levels in co-transfected cells and single transfected cells. O-GlcNAcylation levels were compared in no-transfected cells vs OGT-flag cells and myc-Nkx2.5 cells vs OGT-flag/myc-Nkx2.5 cells. Myc-Nkx2.5 protein levels were compared in myc-Nkx2.5 cells vs OGT-flag/myc-Nkx2.5 cells. All values are presented as the mean±standard error of three independent experiments. *p<0.05. (C) After immunoprecipitation with antibodies specific for Nkx2.5 and flag, immunoblotting with antibodies for myc, flag, and OGT was performed. (D) After immunoprecipitation with antibodies specific for OGT, immunoblotting with antibodies for myc, flag, and OGT was performed. The interaction between myc-Nkx2.5 and OGT-flag was observed.

