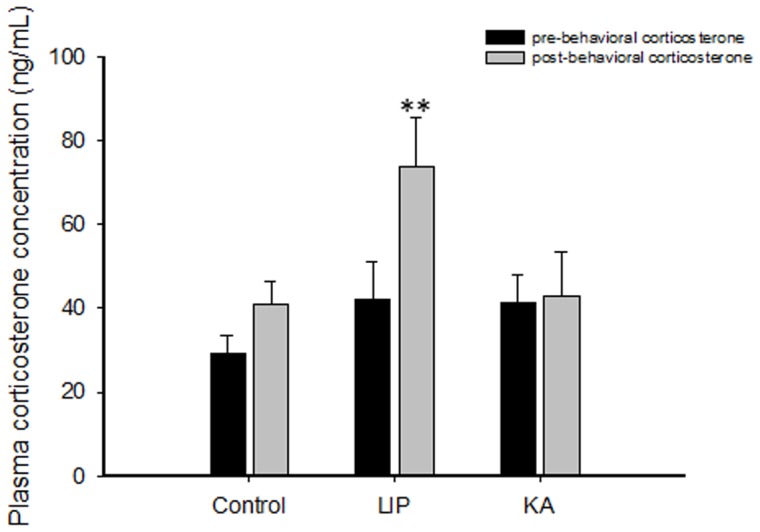
Figure 4. Plasma corticosterone levels assessed before (pre-behavioral phase) and after (post-behavioral phase) the behavioral tests.

The results are presented as the mean ± SEM. ** P<0.01 vs. the corresponding pre-behavioral data from the same group. For this analysis, strains were pooled. Abbreviations: LIP: lithium-pilocarpine; KA: kainic acid.
