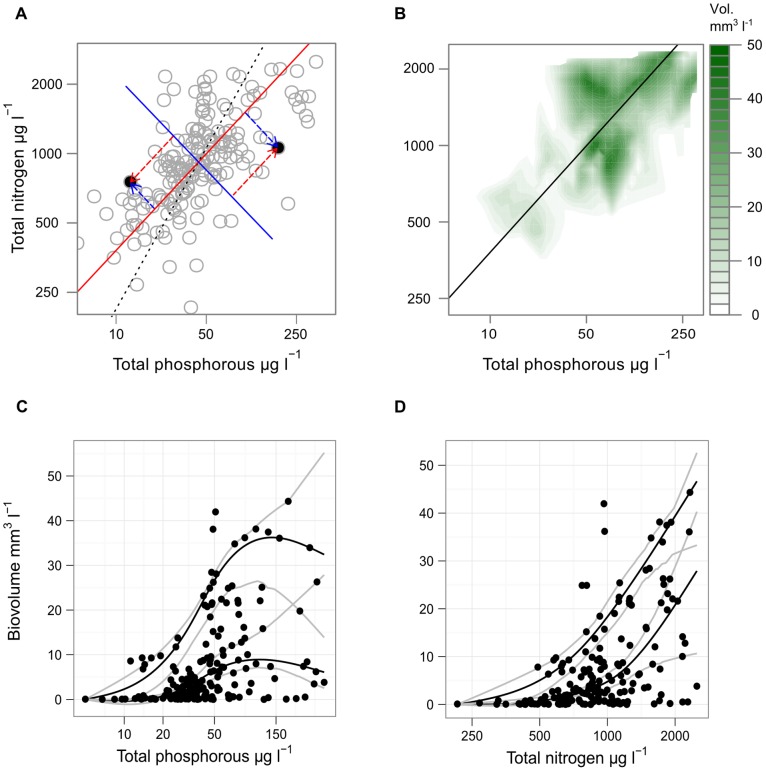
Figure 1. Relationships between TN, TP and total cyanobacterial biovolume.
(A) the relationship between total phosphorus and total nitrogen, with a fitted standardised-major-axis (solid red line), the corresponding minor axis (solid blue line), and an isoline (dotted black) indicating points where the TN:TP ratio is equal to the average for the data set. The red arrows illustrate how a point’s joint NP enrichment score is defined as its position on the standardised-major-axis between TN and TP, while the blue arrow shows how its relative TN vs. TP enrichment score is defined as its position on the minor axis. (B) a filled contour plot indicating the fitted 90% quantile of total cyanobacteria biovolume as an estimate of the maximum expected biovolume at combinations of TN and TP concentration. (C) the relationship between cyanobacterial biovolume and total phosphorus and (D) total nitrogen concentration. Fitted lines are natural splines with 4 degrees of freedom showing the 90% and 50% quantiles of observations as a function of TP and TN. Splines were forced through the origin corresponding to an assumption of zero biovolume at zero nutrient concentrations.

