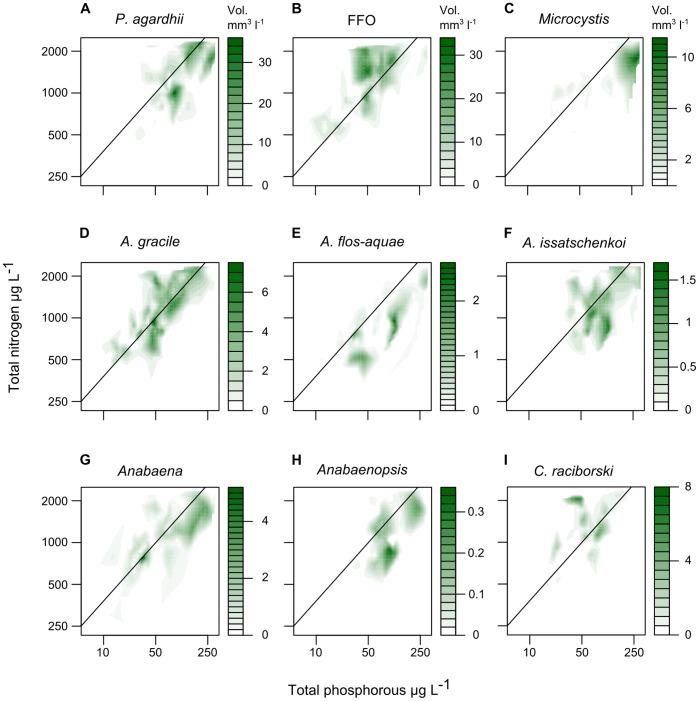
Figure 2. Filled contour plots of maximum biovolumes of nine cyanobacterial taxa on TN and TP axes.
Filled contour plots showing, for 9 taxonomic groups of cyanobacteria, the fitted 90% quantile of biovolume as an estimate of the maximum expected biovolume of each taxa for a range of TN and TP concentrations.

