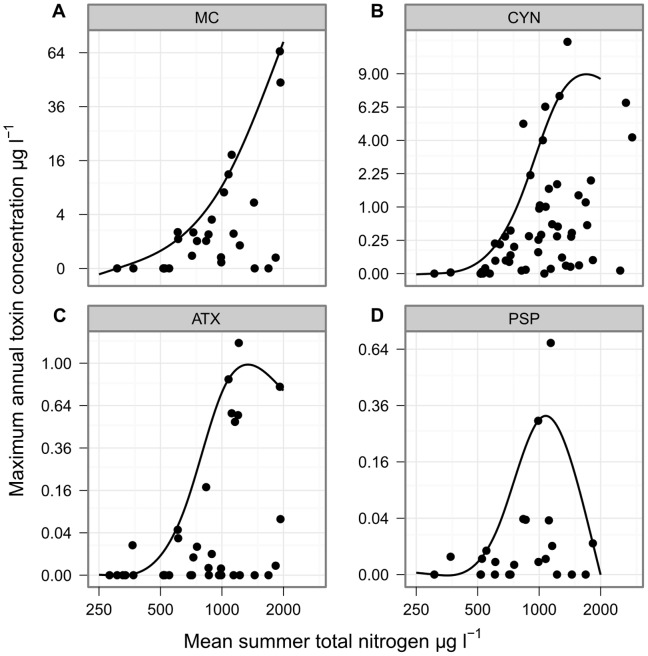
Figure 6. Maximum annual concentrations of four cyanotoxin groups against mean summer TN concentration.
The relationship between annual maximum concentration of four cyanotoxins and mean summer TN concentration for lakes in Berlin and Brandenburg, Germany. The fitted line indicates the 90% quantile of toxin concentration as an estimate of the maximum expected concentration of toxin for a given TN concentration. Each point represents the mean TN and maximum toxin concentration for one lake–summer.

