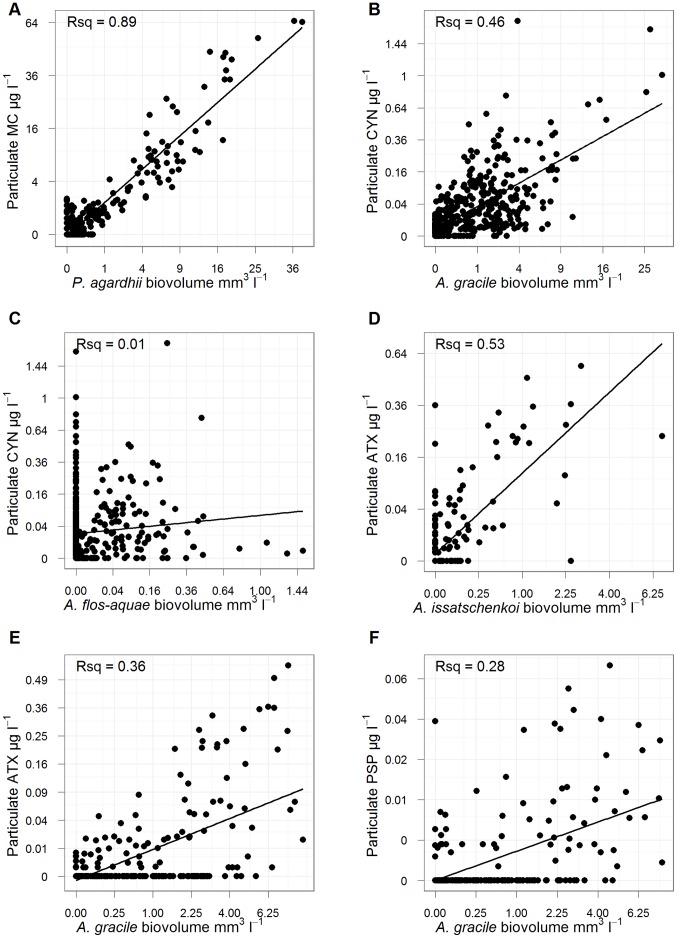
Figure 7. Correlations between the concentrations of four cyanotoxin groups and their potential producing taxa.
Correlations between four cyanotoxin groups and previously identified potential producing cyanobacterial taxa. Correlations are between the particulate fractions of the toxin groups and biovolumes from individual sampling dates. For each subplot, points come from multiple years and lakes.

