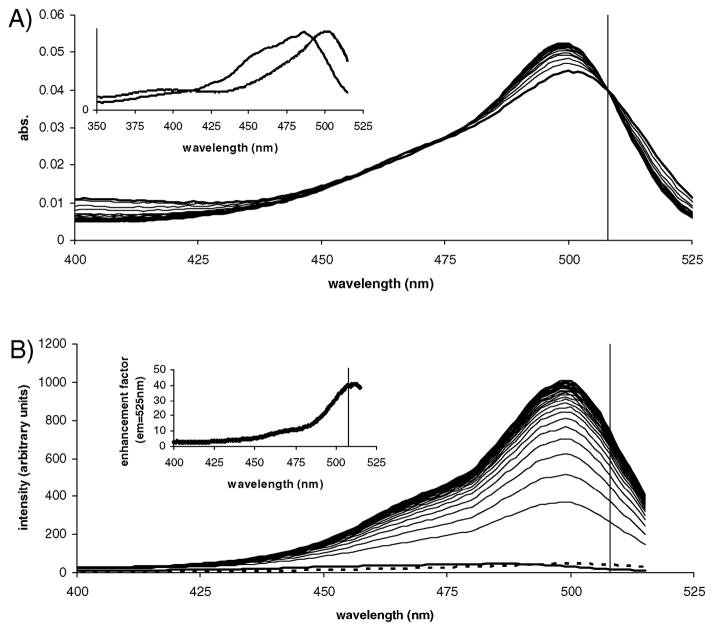
Fig. 1.
Spectral properties of compound 1 (9.38 ×10⁻⁷ M) in the presence of Cys (10.0 mM). (A) Absorption spectra as a function of time (60 min). Inset: normalized absorption and excitation spectra of 1. (B) Excitation spectra monitored at the 525 nm emission peak of the reaction product as a function of time (60 min). Inset: fluorescence enhancement factor of compound 1 as a function of excitation wavelength. Vertical lines represent the optimized wavelength of 508 nm chosen for excitation of all subsequent emission spectra. All spectra were collected at rt. Excitation and emission bandpass = 5 nm.

