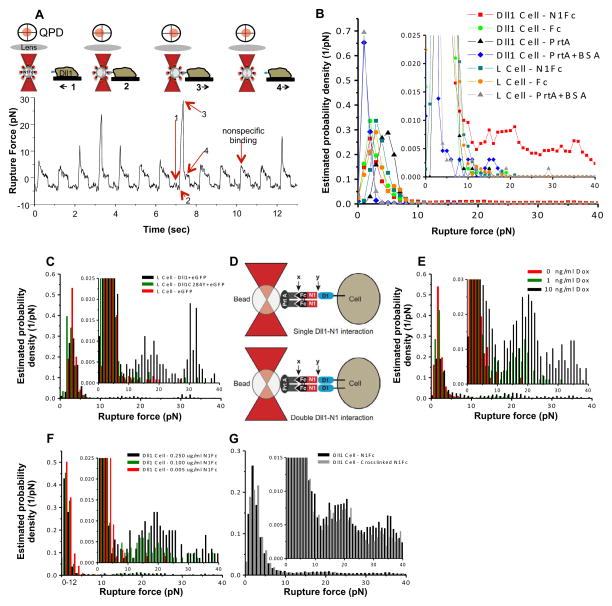
Figure 1. Optical tweezers to specifically measure the strength of Dll1-N1 interactions.
(A) Schematic representation of a trapped bead presented to a live cell and a protoypical acquired force waveform. The optical tweezers beam is recollected by a lens and directed towards a quadrature photodiode (QPD) to monitor bead displacement. The experiment cycles through four stages: (1) cell moves towards the bead (small viscous forces push the bead slightly to the left); (2) cell is pushed against the bead to promote molecular interactions; (3) cell moves away from the bead until interactions rupture and (4) bead is pulled back into the trap and the cell continues to move rightward (viscous forces push the bead slightly to the right). Force is the product of trap stiffness and bead displacement. See Supplemental Information for details.
(B) Rupture force spectra obtained for N1Fc or control beads interacting with L and Dll1 cells. The tall peaks common to all spectra represent non-specific interactions. Insert represents enlargement of rupture force data.
(C) Rupture force spectra for cells expressing the Dll1 binding mutant Dll1C284Y compared to those obtained for Dll1 or eGFP controls .
(D) The N1Fc dimer presents two possible Dll1 binding sites for detection of single or double Dll1-N1 interactions. The two possible rupture sites for PrtA-Fc (X) or Dll1-N1 (Y) interactions are indicated.
(E) Rupture force spectra for N1Fc beads and cells treated with Dox to induce Dll1.
(F) Rupture force spectra for Dll1 cells interacting with beads functionalized with decreasing N1Fc and increasing Fc concentrations.
(G) Rupture force spectra for Dll1 cells with N1Fc beads following chemical crosslinking.
See also Figure S1. Sample sizes for rupture force spectra can be found in Table S1.

