Figure 1.

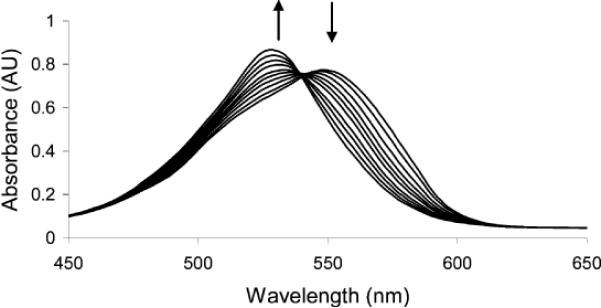
UV–vis spectra of solutions of 1 (1.64 × 10⁻⁵ M, 0.16 M pH 9.5 carbonate buffer in 1:2 MeOH/H2O) upon titration with d-fructose. The final concentration of fructose was 8.33 × 10⁻⁴ M.

UV–vis spectra of solutions of 1 (1.64 × 10⁻⁵ M, 0.16 M pH 9.5 carbonate buffer in 1:2 MeOH/H2O) upon titration with d-fructose. The final concentration of fructose was 8.33 × 10⁻⁴ M.