
Figure 1. Kinetics of synapsin and α-synuclein in axons.
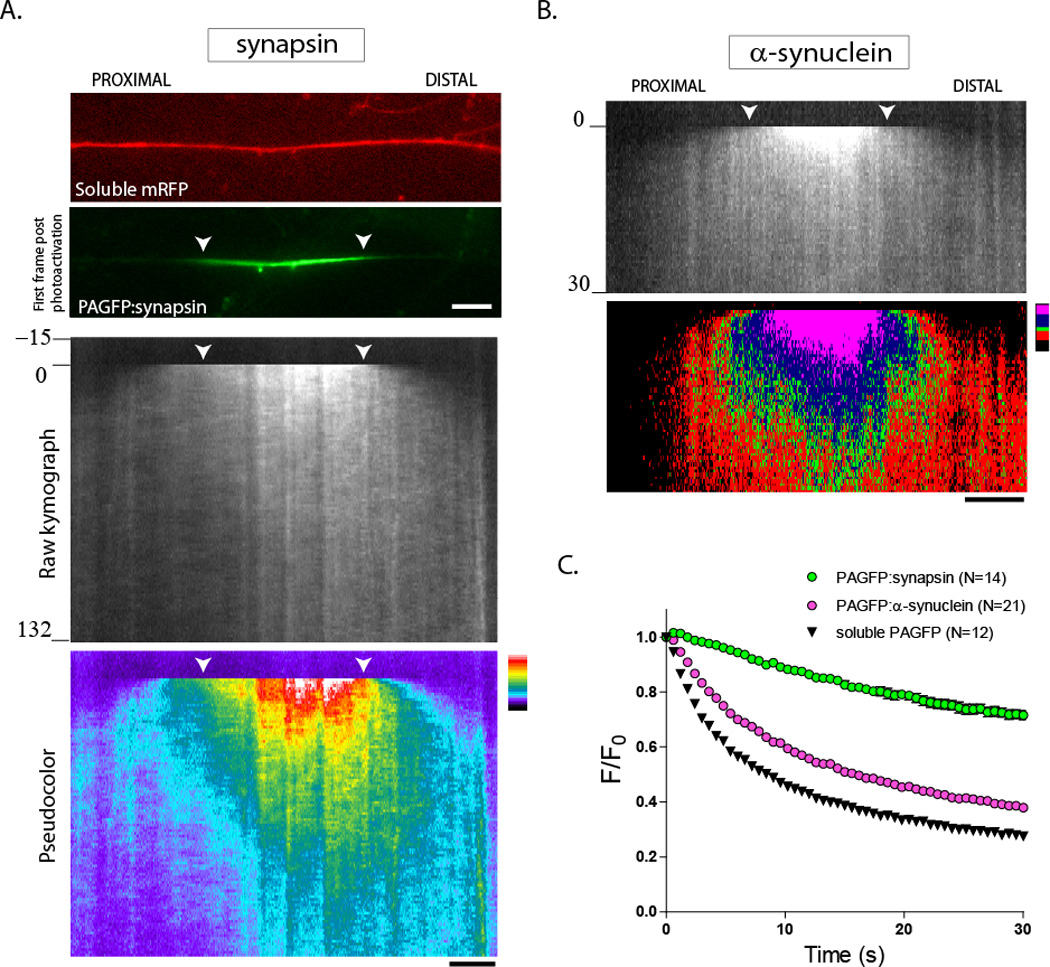
Cultured hippocampal neurons were co-transfected with PA-GFP synapsin (or PAGFP:α-synuclein) and soluble mRFP (to locate transfected axons), a discrete axonal ROI was photoactivated, and the activated zone was visualized by live imaging. Anterograde is left to right, white arrowheads mark the photoactivated ROI throughout the figure.
(A) Images show a transfected axon with soluble mRFP (top); an image of PAGFP:synapsin immediately after photoactivation is also shown (bottom). The raw kymograph demonstrates the biased movement of photoactivated synapsin. The same kymograph is pseudocolored (bottom), highlighting the anterogradely-biased plume of fluorescence.
(B) A similar anterograde bias is also seen with α-synuclein.
(C) Graph demonstrates rate of fluorescence decay of PAGFP-tagged proteins within the photoactivated ROI over time. Note that the fluorescence decay is slowest for synapsin, whereas α-synuclein decays much faster, with decay-kinetics almost resembling that of a freely diffusible protein (soluble, untagged PAGFP). These data are consistent with the notion that α-synuclein has higher diffusible pools in axons (see text).
Scale bar = 5 µm; time in seconds shown to the left of the kymographs.