
Fig. 4.
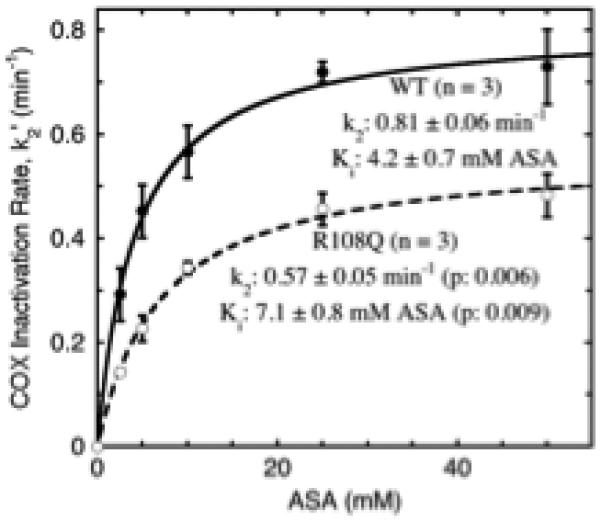
Analysis of Ki and k2 values for aspirin in wildtype PGHS-1 (WT) and the R108Q variant. Apparent COX decay rates during preincubation (k2’ values) were determined at 20 °C at each of the aspirin (potassium salt) levels indicated. Each point and error bars represent the average ± SD at a given aspirin level in three separate k2’ vs. [aspirin] experiments. The parameters shown are the averages ± SD for k2 and Ki values from fits to the Michaelis-Menten equation in the three individual experiments. The lines shown are the fits of the pooled data from all three experiments to the Michaelis-Menten equation. Details are described in Methods.