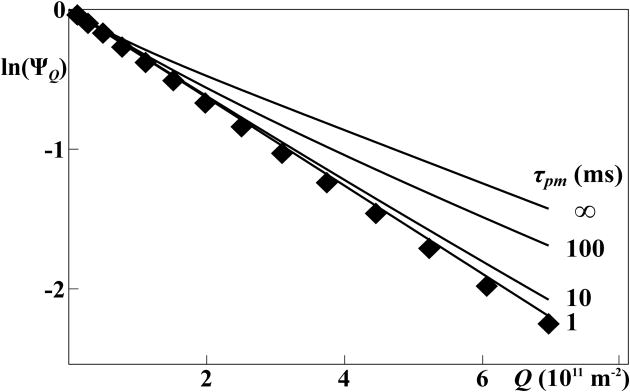
Figure 6.
Signal decays in PFG-STE NMR experiments5,6 with an aqueous solution containing 110 mM Fos-10 and 1 mM OmpX. The diamonds represent experimental measurements collected with a pair of gradient pulses of duration δ = 4.5 ms that were separated by a delay of Δ = 50 ms. The solid lines represent computational simulations for variable life times of Fos-10 monomers in the micelles, using Eqs. (14) and (15) with the assumption that the free micelle concentrations, [m], was 10 mM. All simulations were performed with the mathematics software system Sage (www.sagemath.org), using a previously described diagonalization scheme.25,26

