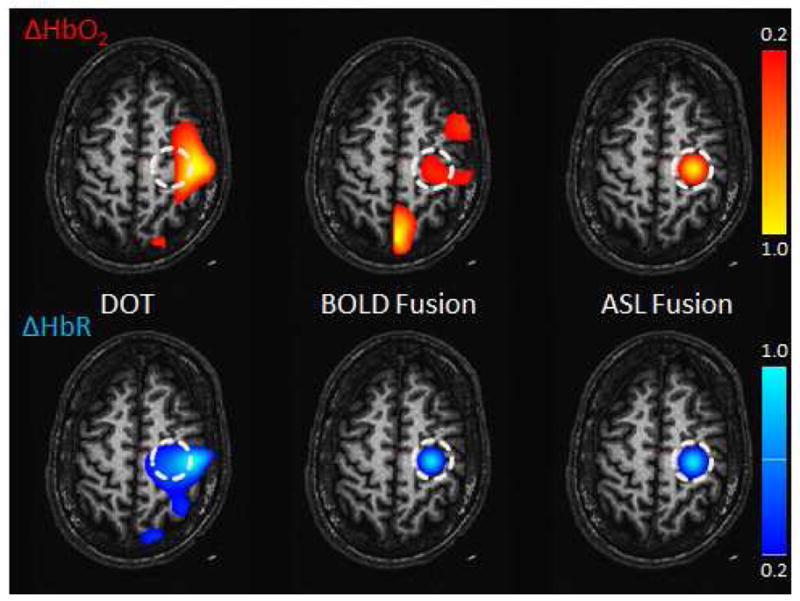
Figure 2.

Simulation Results. The reconstructed hemoglobin concentrations are shown for the DOT-only (left), BOLD fusion (middle) and ASL fusion (right) models. (Top) HbO2 (Bottom) HbR. The sphere-shaped inclusion was located at a depth of 25 mm. The contrast-to-noise ratio (CNR) was set to 20:1 for DOT and BOLD and to 10:1 for ASL. The regularization parameter Γ was set to 10−6 (1 μM). Values are normalized to the maximum and minimum for HbO2 and HbR respectively and then thresholded at 20 % of maximum.
