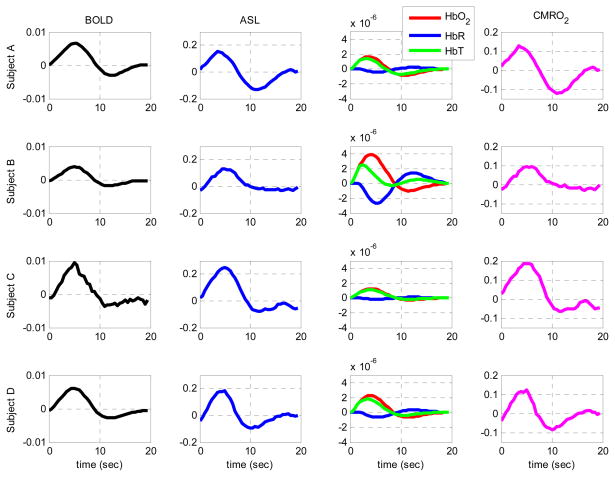
Figure 6.
Time courses of the changes in BOLD signal, ASL, HbO2, HbR, HbT and CMRO2 during the 2-sec finger-tapping stimulation. BOLD, ASL, HbO2, HbR and HbT traces were obtained by averaging the respective signal over the ROI identified from the BOLD activation t-maps. Hemoglobin changes are shown in molars.

