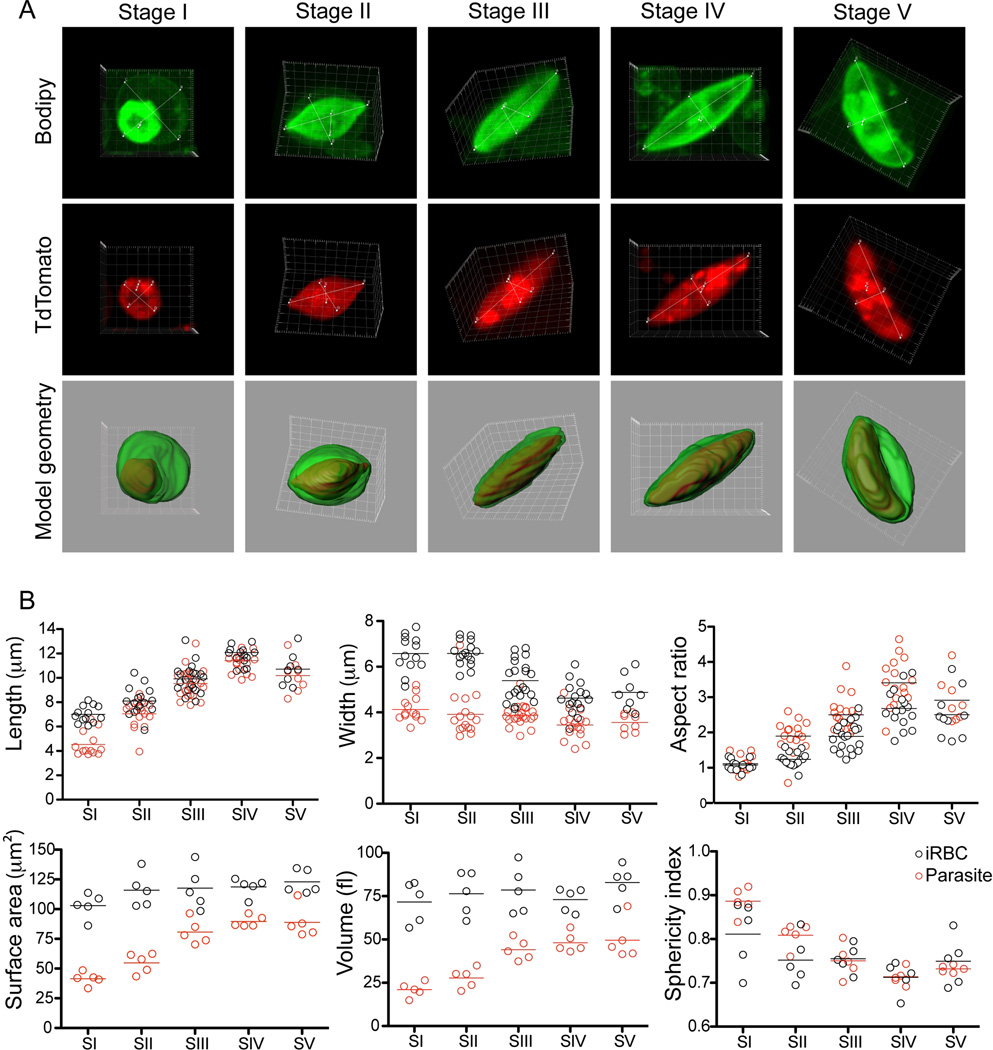
Figure 2. 3D analysis and key parameters during sexual development. A. Gametocyte development in three dimensions.
Shown is one representative cell per stage. Each cell is shown as a maximum projection; red (TdTom), green (Bodipy-FL5- Ceramide) and as a surface rendered merge of the 2 channels. Measurements for aspect ratios are included. Movies of the original files for each cell shown are available as supplementary material. Images were taken using an Olympus FV1000 confocal microscope equipped with a 100×/1.4 oil immersion lens and stacks collected using Fluoview software. Three-dimensional images were constructed using the Imaris software. B. Calculation of vital parameters. Length (x), width (y) and thickness (z) dimensions were measured from n=13 (Stage I), n=16 (Stage II), n=21 (Stage III), n=15 (Stage IV) and n=8 (Stage V). The complete data set is available as supplementary table S3.

