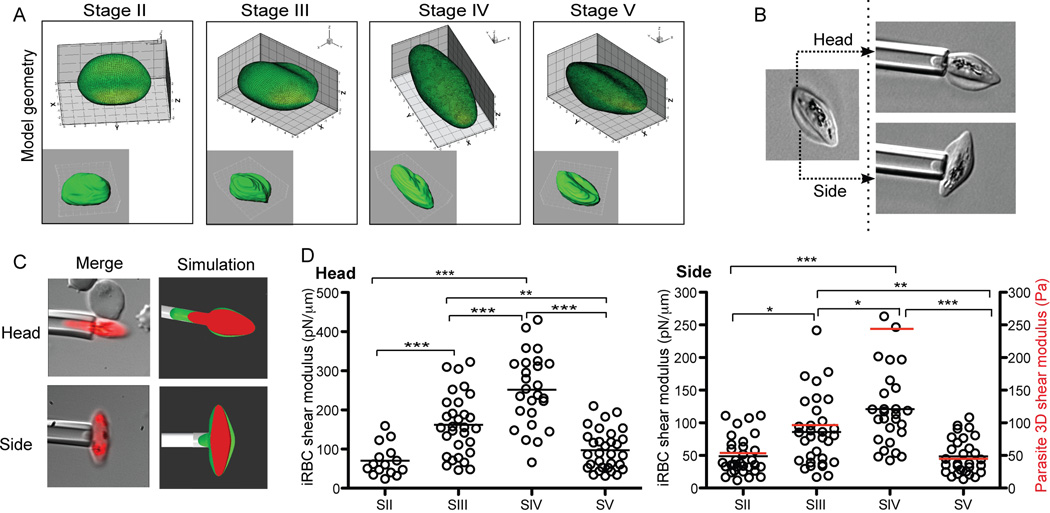
Figure 3. Micropipette aspiration assays in developing gametocytes. A. Definition of cell shape.
For each stage the 3D reconstruction of a representative cell was used to calculate the geometry of the iRBC as a correlate for cell shape. B/C. Schematic of capillary measurements. In order to account for the irregular shape of gametocyte-infected RBCs, the cell was aspired from side and head separately. In addition a fluorescence image of the iRBC was captured at the endpoint of the assay. D. Side and head shear modulus calculations and parasite rigidity. Shown are individual data points and mean for each stage. Average parasite rigidity is shown as a red bar in the side shear modulus graph. After ensuring that the data for each stage did not deviate severely from normality and that the assumptions for ANOVA are met, we performed a one-way ANOVA, followed by Turkey's HSD procedure to test the difference between each pair of stages. The final p-values from this test are given by *, p<0.005; **, p<0.001; ***, p<0.0005.

