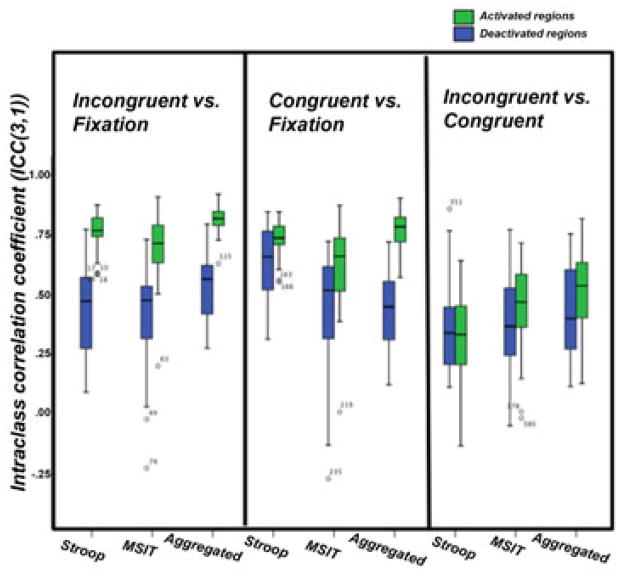
Figure 3.
Boxplots of the distributions of within-individual ICCs among participants for incongruent vs. fixation, congruent vs. fixation, and incongruent vs. congruent contrasts in the activated and deactivated regions for the Stroop task, MSIT, and the aggregated (or average) contrasts across both tasks. Note that ICCs can range from −1 to 1, where negative ICCs can be attributed to more variation within than between voxels.

