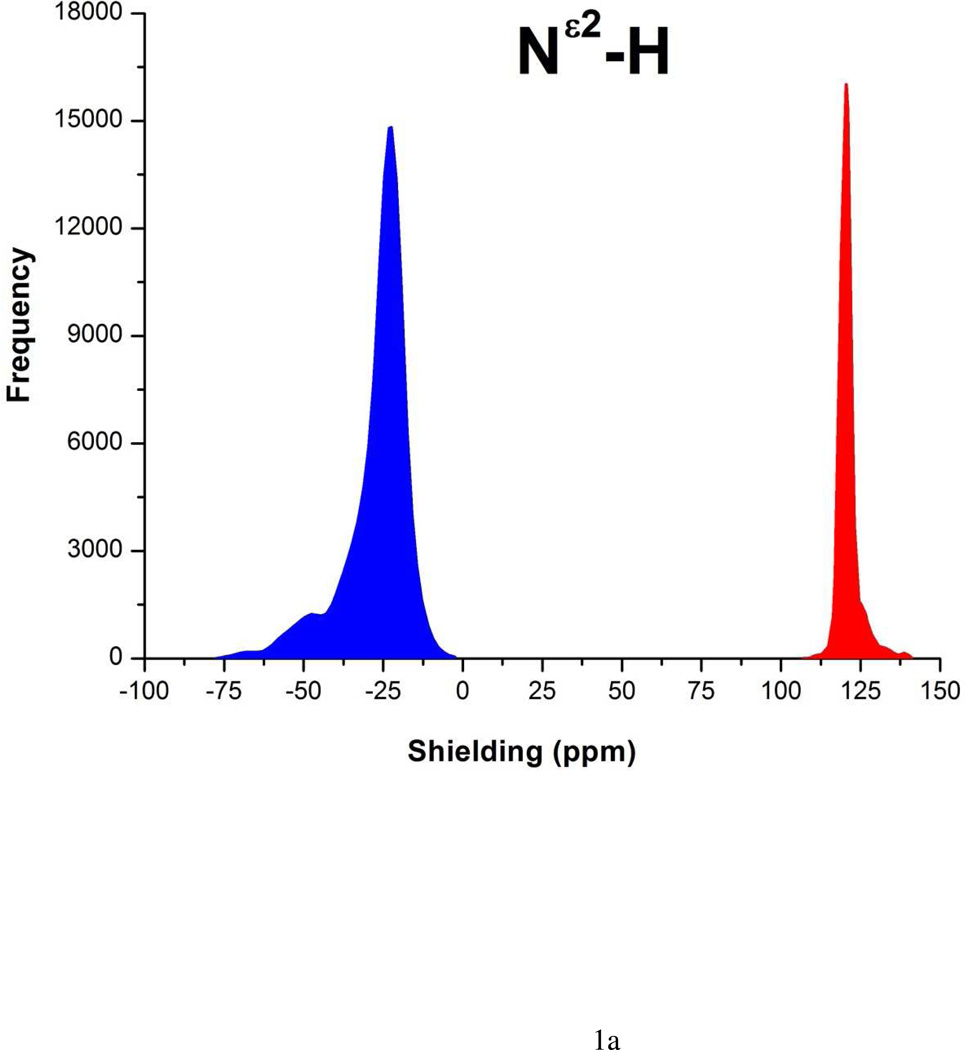
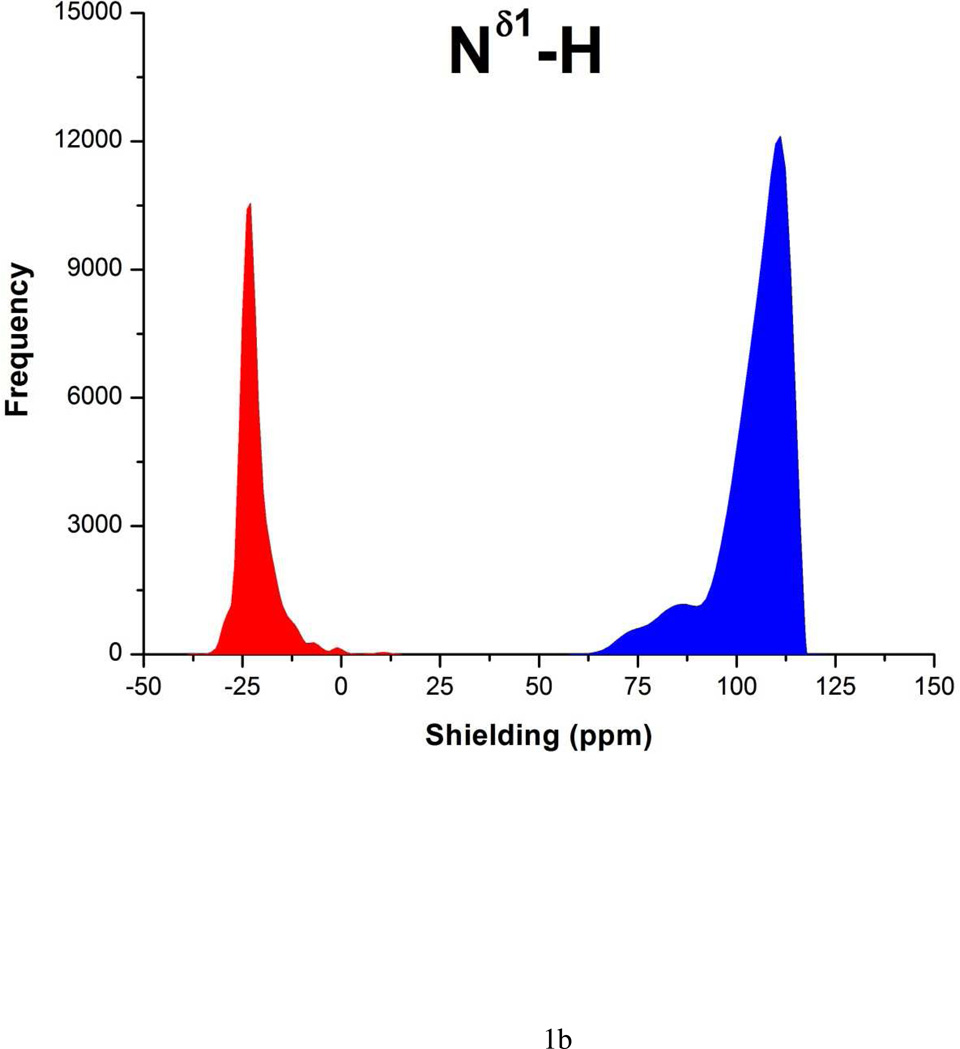
Figure 1.
(a) The red-filled and blue-filled profiles for the shielding of the 15Nε2 and 15Nδ1 nucleus, respectively, of the imidazole ring of His, in the 15Nε2-H tautomer represent the histogram of the ~35,000 DFT-computed shielding distribution from the model tripeptide Ac-GHG-NMe; the corresponding average value and standard deviation of the red-filled and blue-filled profiles are: 121 ± 3 ppm and −27 ± 10 ppm, respectively; and (b) same as (a) with average value and standard deviation of: −22 ± 5 ppm and 105 ± 9 ppm, respectively, for the 15Nδ1-H tautomer.


