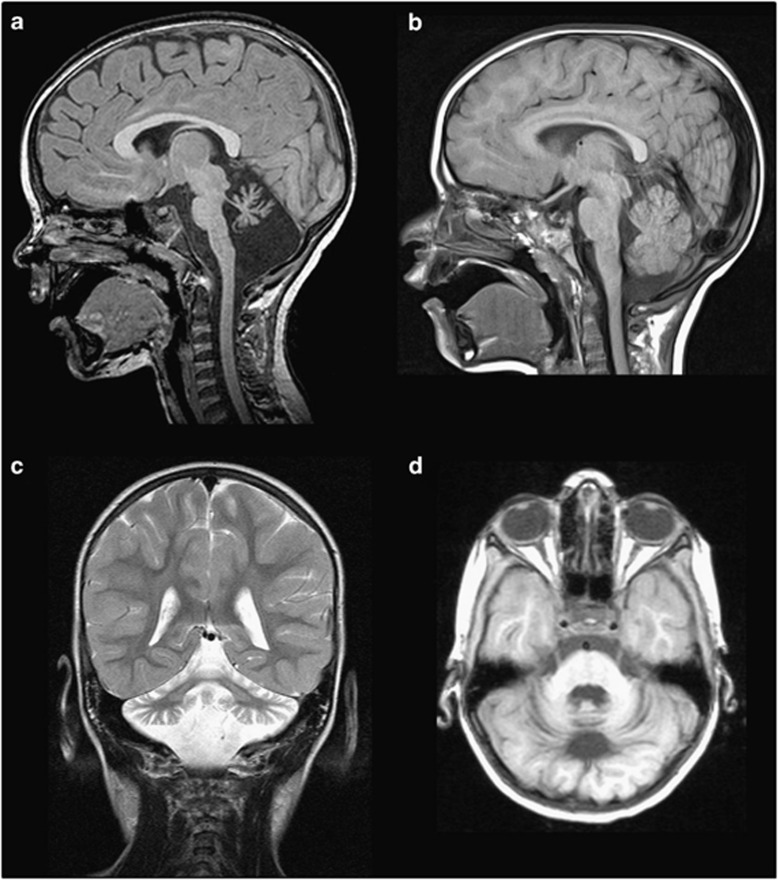
Figure 2.
The brain MRI of the patient with p.Q2202del showing pontocerebellar atrophy. (a) Sagittal T1 image at midline showing severe atrophy of vermis with hypoplastic brainstem. The corpus callosum is larger than normal for the age of the patient. (b) Sagittal T1 image of an age and gender matched control showing normal pons and normal cerebellum (c) Coronal T2 image of the patient at the level of the posterior fossa, showing severe atrophy of both cerebellar hemispheres with T2 hypersignal of both middle cerebellar pedoncule. (d) Axial T1 image of the patient at the level of the cerebellum showing diffuse cerebellar atrophy.

