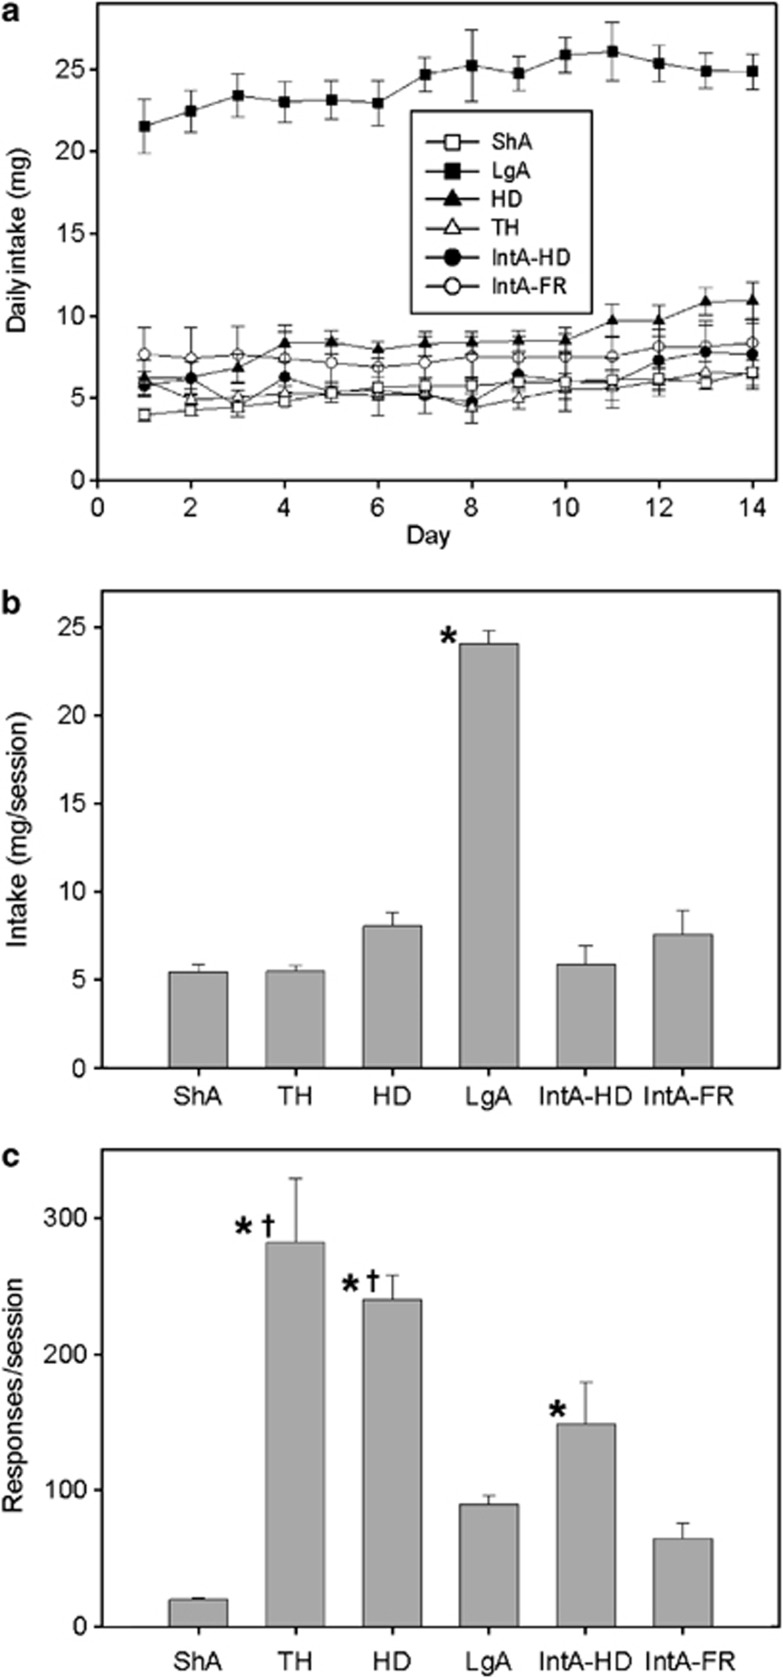
Figure 2.
Average intake and responses during the 2-week test period. Panel (a) shows the daily intake self-administered for each day over the 14-day test period for each group. Each symbol represents the mean intake self-administered for that group (±SEM). Panel (b) shows the average (±SEM) intake per session for each group. LgA animals self-administered significantly more cocaine than all other groups (p<0.001). Panel (c) shows the responses per session for each group. Bar represents the mean (±SEM) number of responses per session. The TH, HD, and IntA-HD groups responded significantly more than ShA animals (*p<0.05), and both TH and HD groups responded more than the IntA-FR group (†p<0.05).

